


Foreword by EBA
EBA regularly hosts students writing their master’s theses. The aim is to provide an environment — and thus perspectives — that complements the university campus. Students who have successfully defended their thesis are offered the opportunity to publish it ”as is” (edited as they see fit) in EBA’s working paper series. By this, we want to contribute to the broader dissemination of relevant new knowledge produced by fledgling master’s graduates.
Since these papers are interdisciplinary, the working paper versions contain an additional non-technical summary (in English and Swedish) to make the results accessible to a wider audience than those familiar with the academic language and jargon of the respective discipline.
This thesis studies how member countries of the OECD’s Development Assistance Committee (DAC) collectively respond to Chinese development finance in Africa. In particular, the author exploits the launch of the Belt and Road Initiative to investigate how China’s expansion across Africa affects the level and allocation of DAC development finance. Do they, for example, act competitively, increasing their investments in the same sectors as China (”crowding in”), or do they step out of those sectors (”crowding out”), and reallocate finance following a needs-based (”altruistic”) logic? The author finds no effect on the allocation of concessional aid (Official Development Assistance, ODA). However, DAC countries tend to increase non-concessional official flows in those countries and sectors where Chinese development finance has expanded the most.
We hope that this paper will find an audience outside academia. It nicely complements previous reports published by EBA, first and foremost the anthology ”China as a Global Development Actor: Transforming the International Aid Landscape” (EBA Report 2025:08) and ”Perceptions and Power: Assessing the Impact of Russia’s Influence on Development Cooperation and Attitudes in Africa” (EBA Working Paper, Dec. 2025).
EBA working papers are shorter studies that investigate a question of limited scope or that complement a regular EBA report. Authors are solely responsible for the content of the paper.
Stockholm, September 2026
Jan Pettersson, Managing Director
Sammanfattning
Under de senaste decennierna har Kina fått en allt större roll inom internationellt utvecklingssamarbete, inte minst i Afrika. Kinas växande närvaro på kontinenten speglar både afrikanska länders utvecklingsbehov och Afrikas geopolitiska och ekonomiska betydelse, bland annat som en viktig källa till naturresurser, en växande marknad och en betydelsefull partner och röst i internationella forum. Samtidigt som Kinas roll inom det internationella utvecklingssamarbetet växer minskar flera traditionella givare sina biståndsbudgetar. Detta kan skapa större utrymme för Kina att positionera sig som utvecklingsfinansiär och påverka utvecklingen av biståndslandskapet.
Kinas utvecklingsfinansiering skiljer sig från det bistånd som ges av medlemmarna i OECD:s biståndskommitté DAC (Development Assistance Committee). Medan DAC-ländernas utvecklingsfinansiering till stor del består av bistånd (ODA) består den kinesiska utvecklingsfinansieringen i högre grad av lån och investeringar, som i studien klassificeras som OOF-liknande flöden (övriga offentliga finansiella flöden). Kina har också lagt stor vikt vid investeringar i ”hårda” sektorer, såsom energi, transport och annan infrastruktur, där traditionella givare historiskt har riktat sitt bistånd i mindre utsträckning. Kinas utvecklingssamarbete betonar dessutom partnerskap och ömsesidiga ekonomiska fördelar, snarare än att enbart utgå från traditionella biståndsmål som fattigdomsbekämpning. Dessa skillnader väcker frågan om hur DAC-länder svarar på Kinas växande roll som utvecklingsfinansiär. Väljer de att öka eller minska sin egen utvecklingsfinansiering i de länder och sektorer där den kinesiska utvecklingsfinansieringen har ökat som mest?
I denna studie undersöks hur Kinas ökade utvecklingsfinansiering i Afrika påverkar nivån och allokeringen av utvecklingsfinansiering från DAC-länderna. Analysen skiljer mellan två typer av finansiella flöden: traditionellt bistånd, på engelska benämnt Official Development Assistance (ODA) och övriga offentliga finansiella flöden, Other Official Flows (OOF).
Hur DAC-länder kan förväntas svara på Kinas växande roll inom det internationella utvecklingssamarbetet är inte självklart, då givarnas respons kan präglas av både samordning och konkurrens. Eftersom den kinesiska utvecklingsfinansieringen i hög grad är investeringsinriktad och koncentrerad till infrastruktur kan DAC-ländernas respons förväntas vara särskilt tydlig inom infrastruktursektorer och skilja sig mellan olika typer av finansiella flöden. Riktningen på responsen beror dock på givarnas bakomliggande motiv. Om DAC-ländernas främsta mål är att bidra till utveckling och fattigdomsminskning kan de ha incitament att samordna sin utvecklingsfinansiering med Kina. Om Kina tillgodoser finansieringsbehov i ett visst land eller en viss sektor kan DAC-givare då välja att omfördela sina resurser till områden där utvecklingsbehoven är större. Det skulle innebära att kinesisk finansiering tränger undan finansiering från andra givare, så kallad crowding-out. Om DAC-ländernas utvecklingsfinansiering däremot drivs av ekonomiska och strategiska intressen kan Kinas växande närvaro leda till ökad konkurrens om ekonomiskt och politiskt inflytande. DAC-givare kan då i stället tänkas öka sin utvecklingsfinansiering i samma länder och sektorer som Kina, vilket innebär crowding-in. Eftersom den kinesiska utvecklingsfinansieringen till stor del består av OOF-liknande finansiering kan DAC-givarnas respons dessutom förväntas skilja sig mellan bistånd (ODA) och övriga offentliga finansiella flöden (OOF).
I studien används data över kinesiska och DAC-givares finansiella flöden till 56 afrikanska länder under perioden 2000–2021. Studien utnyttjar lanseringen av Kinas Belt and Road Initiative (BRI) år 2013. BRI är ett stort globalt kinesiskt infrastrukturprojekt vars syfte är att stärka förbindelserna mellan Kina och stora delar av omvärlden genom utökade transport- och handelsvägar.
För att uppskatta effekten av ökad kinesisk utvecklingsfinansiering på DAC-ländernas ODA och OOF används en difference-in-differences-metod. Analysen jämför utvecklingen före och efter BRI:s lansering mellan länder och sektorer där den kinesiska finansieringen ökade mer respektive mindre. De största ökningarna återfinns framför allt inom infrastruktur, såsom energi och transport, vilket speglar Kinas expansion inom dessa sektorer i Afrika. Jämförelsen gör det möjligt att studera DAC-givarnas respons på Kinas expansion samtidigt som hänsyn tas till mer generella förändringar i bistånd och utvecklingsfinansiering över tid. Metoden bygger på antagandet att de jämförda grupperna skulle ha utvecklats på liknande sätt om BRI inte hade lanserats.
Resultaten visar inga belägg för en crowding-out-effekt av kinesisk utvecklingsfinansiering på DAC-länders utvecklingsfinansiering. För ODA går det inte att statistiskt säkerställa någon förändring efter 2013 i de land–sektor-par som var mest exponerade för ökningen i kinesisk finansiering. Det innebär att studien varken finner stöd för att DAC-givarna minskar sitt bistånd i dessa områden eller för att de ökar det. Däremot identifieras en statistiskt säkerställd crowding-in-effekt för övriga offentliga finansiella flöden (OOF). I de länder och sektorer där kinas utvecklingsfinansiering ökade mest ökade DAC-ländernas OOF i genomsnitt med 0,229 miljoner USD efter 2013 jämfört med utvecklingen i mindre exponerade länder och sektorer. Även om ökningen är relativt liten i absoluta tal motsvarar den en ökning med 166 % jämfört med nivån före 2013.
Särskilt anmärkningsvärt med resultatet är att DAC-ländernas respons återfinns i OOF snarare än i bistånd (ODA). En möjlig tolkning är att DAC-givare svarar på Kinas expansion genom att öka mer investeringsinriktad finansiering i samma länder och sektorer som Kina, och att ekonomiska, strategiska och geopolitiska överväganden spelar en roll i denna respons. Ökningen sker främst inom sektorer relaterade till infrastruktur. Detta ligger också i linje med senare initiativ som EU:s Global Gateway och G7:s Partnership for Global Infrastructure and Investment, som lägger större vikt vid investeringar i infrastruktur. Studien kan dock inte avgöra varför DAC-länderna ökar sin OOF, och resultaten bör därför inte tolkas som direkta belägg för att strategisk konkurrens är den bakomliggande orsaken.
Resultaten väcker även frågor om hur målen för det internationella utvecklingssamarbetet påverkas när ekonomiska och strategiska intressen får större betydelse. Om utvecklingsfinansiering i första hand fördelas utifrån utvecklingsbehov skulle DAC-givare kunna förväntas rikta resurser mot länder och sektorer där finansieringsbehoven är störst, snarare än mot områden där den kinesiska finansieringen redan är omfattande. Studien bidrar därmed till förståelsen för hur traditionella biståndsgivare anpassar sig till Kina som en framväxande utvecklingsfinansiär och aktualiserar frågan om ökad samordning mellan Kina och traditionella givare för att främja utvecklingssamarbetets långsiktiga mål.
Dessa frågor är relevanta för Sverige och andra DAC-länder i en tid av ett föränderligt biståndslandskap, där flera traditionella givare minskar sina biståndsbudgetar samtidigt som Kina får en allt större roll som utvecklingsfinansiär. Studien kan bidra till bredare policydiskussioner om utvecklingsfinansieringens sammansättning och om vilken rollsamordning respektive strategisk konkurrens bör spela i detta nya landskap. Resultaten väcker också frågan om hur DAC-givare kan säkerställa att en ökad betoning på investeringar och strategiska intressen inte sker på bekostnad av utvecklingssamarbetets långsiktiga mål.
Studien bygger på en masteruppsats i nationalekonomi vid Stockholms universitet och innehåller därför relativt omfattande diskussioner om data och empirisk metod. Läsare som främst är intresserade av studiens bakgrund, huvudsakliga resultat och deras betydelse rekommenderas därför läsa kapitel 1–3 och därefter gå direkt till diskussionen och slutsatserna i kapitel 7–8.
Stockholm University – Department of EconomicsMaster’s thesis 30 HE credits – Course code: EC9901Master’s programme in Economics Spring term 2026Supervisor: Ferenc Szucs
Acknowledgements
A warm thank you to my supervisor, Ferenc Szucs, for his valuable guidance and insightful comments. I am also very grateful to the Expert Group for Aid Studies (EBA) for the collaboration and their support throughout this thesis.
Abstract
This thesis examines how Chinese development finance affects the level and sectoral allocation of aid and other official flows from OECD DAC donors to African countries. I analyse this using a difference-in-differences model, exploiting the launch of the Belt and Road Initiative (BRI) in 2013 as an exogenous shock in Chinese development finance. The analysis combines panel data from OECD CRS database and AidData for 56 African countries over the period 2000–2021. The results show no evidence of crowding-out of DAC aid. Instead, there is a statistically significant crowding-in effect in non-concessional flows (OOF), with an estimated increase of 0.229 USD million in treated country-sector pairs, corresponding to a 166 % rise relative to the pre-treatment baseline. The paper finds no statistically significant effect for concessional aid (ODA). The findings suggest that DAC donors may respond strategically and competitively to China’s expansion in Africa by increasing investment-oriented financing in the same countries and sectors as China, primarily in infrastructure-related sectors. These findings shed light on how traditional donors respond to China as an emerging development financier, suggesting that increased competition may shift development cooperation toward more strategic, politically and economically motivated, and investment-driven forms of financing.
Keywords: China, Development finance, OECD DAC, Belt and Road Initiative, Aid allocation, Difference-in differences.
Introduction
In recent decades, China has emerged as a major actor in international development cooperation, with a particularly strong presence in Africa (Yuan et al. 2022). At the same time, traditional donors are scaling back their foreign aid. In 2025, several members of the Development Assistance Committee (DAC) of the Organisation for Economic Co-operation and Development (OECD) significantly reduced their aid spending, contributing to the largest annual decline in foreign aid (OECD, 2026a). Around the same time, USAID[1] was dismantled, which has historically been one of the world’s largest donors, providing around USD 62 billion in 2023 alone (van Teutem & Ritchie, 2025). This rapidly changing aid landscape raises important questions about China’s growing role as a development financier and highlights the need to better understand how traditional donors adjust their aid allocation strategies in response.
Africa has become the primary destination for Chinese development finance, making it a relevant case to study donor responses. China’s engagement reflects both Africa’s development needs and its geopolitical and economic importance, including its role as a source of natural resources, a growing market, and a political partner in international forums. Africa has also become a central region within the Belt and Road Initiative (BRI), China’s large-scale infrastructure project launched in 2013 (Yuan et al., 2022). By expanding financing in infrastructural sectors where traditional Western donors have been less active, China’s growing role has increased recipient countries’ bargaining power and raised questions about how DAC donors should adapt their development strategies (Lomøy, 2021).
This thesis is motivated by the growing importance of China as a development financier, whose emergence has altered donor-recipient relationships and increased the focus on “hard” sectors such as infrastructure, transport, and energy. Understanding how traditional donors respond to this shift is important, as their behaviour may reflect both coordination and competition, with implications for the overall effectiveness of development cooperation. The purpose of this study is to analyse how OECD DAC donors respond to Chinese development finance in Africa by examining changes in aid levels and sectoral allocation across different types of financial flows, namely concessional aid (ODA) and non-concessional financing (OOF). The analysis is restricted to Africa, as the continent has been a major recipient of Chinese development finance, particularly in infrastructure sectors. This focus is further supported by the existing literature, where much of the research on development finance and aid allocation is concentrated on Africa. The empirical analysis exploits the launch of the BRI in 2013 as a plausibly exogenous shock to Chinese development finance. It identifies effects in recipient countries and sectors where Chinese development finance expanded the most, which primarily are infrastructure related. The research question is:
Does Chinese development finance to Africa affect the level and sectoral allocation of aid and financial flows provided by OECD DAC donors? More specifically, does Chinese development finance crowd in, crowd out, or alter the composition of DAC ODA and/or OOF?
Identifying DAC donors’ responses to Chinese development finance is challenging because aid allocation decisions are endogenous. Both China and DAC donors may respond to the same underlying factors, such as recipient needs, economic conditions, geopolitical importance, or infrastructure demand. In addition, China may expand financing in countries and sectors where DAC donors were already active, creating potential concerns about reverse causality, making it difficult to distinguish actual donor responses from pre-existing allocation patterns.
To answer the research question, I exploit the introduction of China’s BRI and estimate a difference-in-differences (DiD) model using panel data for African countries over the period 2000–2021. The timing of treatment is given by the launch of the BRI in 2013. Arguably, the BRI was mainly motivated by China’s geopolitical ambitions rather than any changing demands of African countries for development finance, making the BRI a plausibly exogenous, politically driven shock. Moreover, as the initiative was introduced independently of DAC donor behaviour, it is unlikely to reflect reverse causality of Chinese financing responding to Western aid allocations. Instead, it provides plausibly exogenous variation in the timing and intensity of Chinese development finance across countries and sectors in Africa.
Treatment is defined at the country-sector level and assigned to the top 20 % most exposed country-sector pairs to Chinese development finance, following the launch of the BRI. These treated pairs are predominantly concentrated in infrastructure related sectors, reflecting the scope and strategic focus of Chinese development finance in Africa. The identifying assumption is the parallel trend assumption. It states that, had the BRI not taken place, treated and control pairs would have followed similar trends in OECD DAC ODA and OOF allocation over time. I provide supporting evidence to this assumption through an event study estimation.
Existing research characterises foreign aid as driven by a combination of altruistic, political, economic, and strategic motives (see e.g. Dreher et al., 2013; Alesina & Dollar, 2000). As a result, donor allocation decisions may reflect both coordination and competition. Studies on donor interdependence find evidence of both crowding-in effects and heterogeneous responses across donors and sectors, with crowding-in effects being particularly pronounced in infrastructure and production sectors (e.g. Davies & Klasen, 2019; Ferrière, 2022; Barthel et al., 2014). As Chinese development finance varies across countries and sectors, any DAC response may be strongest where Chinese engagement has expanded most. Given the strategic, investment-driven, and infrastructure-heavy nature of Chinese development finance, DAC responses may therefore be more likely to occur in infrastructure sectors and may differ across types of financial flows. The direction of the response, however, depends on the underlying motivation. If DAC donors perceive Chinese financing as reducing unmet development needs, they may redirect resources where needs are greater, resulting in crowding-out. Conversely, if China’s engagement is perceived as signalling economic opportunities or increasing competition for influence, DAC donors may instead increase their financing in the same countries and sectors, resulting in crowding-in. Since Chinese development finance relies heavily on non-concessional financing, these responses may also differ between DAC ODA and OOF.
The results show that DAC donors increase their non-concessional flows (OOF), but not their concessional aid (ODA), in country-sector pairs where Chinese development finance has expanded the most. The observed crowding-in effects in OOF may suggest that DAC donors respond strategically to China’s engagement in Africa rather than reallocating aid based on recipient needs. Particularly striking is that this response occurs through non-concessional flows rather than concessional aid, indicating a potential shift in the composition (and possibly the objectives) of development cooperation. DAC donors appear to expand investment-driven financing in “hard” infrastructure, more closely resembling Chinese development finance. This may raise concerns about a potential misalignment with needs-based aid allocation principles, where aid should be directed to areas where needs are greater and financing gaps remain. From a policy perspective, the findings could suggest that greater coordination with China, rather than competition, may improve the effectiveness of development cooperation and help ensure that financial flows remain aligned with long-term development goals.
This paper contributes to the relatively limited literature on donor interactions by providing new empirical evidence on how OECD DAC donors respond to the growth of Chinese development finance. It also adds to the growing body of research on China as an emerging development actor. This topic is particularly relevant in a context where traditional donors are scaling back. The results may be relevant for Sweden and other DAC donors by contributing to broader policy discussions about aid strategies in this evolving landscape, including the composition of development finance and the role of coordination versus strategic competition.
The thesis is organised as follows: Section 2 provides an overview of the BRI, China’s engagement in Africa, and the OECD’s definition of foreign aid. Sections 3 presents the literature review. Section 4 describes the data and the construction of the treatment variable, while section 5 outlines the empirical strategy. Section 6 presents the results, followed by a discussion in section 7. Finally, section 8 summarises and concludes the study.
Context
The following section first provides an overview of the BRI and its connection to China’s foreign aid. It then highlights China’s engagement in Africa, followed by a discussion on how foreign aid is defined by the OECD and underlines the challenges of applying this definition to Chinese development finance.
Belt and Road Initiative (BRI)
The Belt and Road Initiative (BRI), also known as One Belt, One Road (OBOR), is a large-scale Chinese infrastructure project aimed at improving the communications between China, Asia, Europe, Africa, and Latin America. It was launched in 2013 by President Xi Jinping and has played a central role in shaping China’s foreign aid. The initiative focuses on developing transport and trade networks, primarily through the construction of roads, railways, and maritime routes with associated port infrastructure (NE, 2026).
The initiative has expanded significantly beyond its initial scope. It was originally expected to involve around 65 countries, with projected investment costs ranging from USD 1,000 to 8,000 billion (NE, 2026). By May 2025, around 150 countries had joined the BRI, including 53 African countries (Nedopil, 2025). BRI projects are financed through a combination of Chinese government support, loans, and investments. While many developing countries have viewed the BRI as an opportunity to finance infrastructure and promote economic growth, concerns have also been raised regarding debt sustainability and economic dependence on China (Oud & Almén, 2025).
Over time, the BRI has also expanded beyond physical infrastructure to include digital investments. This expansion is often referred to as the “Digital Silk Road”, covering areas such as telecommunications networks, e-commerce platforms, and data infrastructure. To counteract China’s growing influence, the EU launched a competing initiative in 2021, the Global Gateway, which aims to strengthen digital communication, energy, transport, health, education, and research. The G7 countries also have a similar programme, launched in 2022, called the Partnership for Global Infrastructure and Investment (NE, 2026).
The BRI has become a key platform for China’s international development cooperation and has significantly increased its global economic presence, particularly in infrastructure financing (Yuan et.al., 2022). China’s development finance has been argued to serve strategic purposes, including strengthening relations with countries of geopolitical importance. This involves securing access to natural resources as well as fostering political alignment, as countries dependent on Chinese financing may be more likely to support China’s positions in international forums (Oud & Almén, 2025). The BRI is thus often interpreted as a geopolitical strategy rather than a purely economic one.
China’s engagement in Africa
China’s relationship with Africa dates back to the 1950s, and African countries were among the earliest recipients of Chinese foreign aid (Yuan et al., 2022). Over time, Africa has become the primary destination of China’s development finance, while China has become Africa’s largest trading partner and a major provider of infrastructure financing (Tiboris, 2019). This engagement reflects both Africa’s development needs and its geopolitical and economic importance to China. In recent years, Africa has also become a central region within the BRI, further strengthening the link between China’s development finance and its broader strategic objectives (Yuan et al. 2022).
China’s approach to development finance is strongly shaped by its own domestic development experience, where transport infrastructure (roads, railways, ports, and airports) has been a starting point and a key driver of economic growth. This view on development is also reflected in China’s engagement in Africa, with one of the earliest infrastructure projects being the Tanzania–Zambia Railway in the 1970s (Yuan et al., 2022). This has been followed by a major expansion of infrastructure projects across the continent. In recent years, this involvement has extended to digital infrastructure, with firms such as Huawei and ZTE building a large share of Africa’s telecommunications networks (Rudyak, 2025).
China’s development finance has created new opportunities for African countries by expanding access to funding, particularly in infrastructural sectors where traditional Western donors have been less active. This broader set of financing options increases recipient countries’ ability to choose among partners and pursue their own development priorities. At the same time, this shift presents a challenge for Western donors, raising questions about how they should adapt their development strategies in response to China’s growing role (Lomøy, 2021). Oud and Almén (2025) note that traditional donors, including Sweden, have increasingly begun to adopt a more transactional approach to development cooperation, prioritising mutual economic benefits rather than focusing solely on poverty reduction.
The OECD definition of foreign aid
The OECD DAC is an international forum consisting of 34 major donor countries. The objective of the DAC is to promote development cooperation that contributes to sustainable development, poverty reduction, and improved living standards in developing countries (OECD, 2026b). Within this framework, foreign aid is typically defined using the OECD definition of Official Development Assistance (ODA). ODA refers to concessional financial flows provided by official agencies, including grants, and grants equivalents of concessional loans, with the primary objective of promoting economic development and welfare in developing countries (OECD, 2024). In addition to ODA, the OECD distinguishes Other Official Flows (OOF), which also originate from the official sector but do not meet the criteria for ODA. These flows are typically less concessional or driven by commercial or export-related objectives, such as loans with low grant elements or transactions aimed at supporting trade (OECD, 2026c). While OOF may contribute to development, it is not considered foreign aid under OECD definitions.
Applying the OECD DAC definition of foreign aid to China’s development finance is not straightforward, as a large share of its financial flows falls outside the ODA framework. China’s development cooperation includes a broad mix of instruments, such as non-concessional loans, export credits, and infrastructure investments. In contrast to DAC donors, who emphasize concessional aid and development objectives, China frames its development cooperation less as a donor-recipient relationship and more as a form of partnership based on mutual economic benefits and shared development goals (Yuan et al., 2022).
Its development finance is often directed towards sectors such as infrastructure, energy, and industry, frequently in countries of strategic importance. This broader composition makes it difficult to distinguish between aid, trade, and investment. Another challenge is the lack of transparency of Chinese financial flows and the absence of adherence to OECD DAC reporting standards, making it difficult to classify these flows and determine what share qualifies as ODA (Oud & Almén, 2025). As most BRI finance is provided through loans and other non-concessional instruments, much of China’s financial engagement would be classified as OOF rather than ODA (Yuan et al., 2022).
Given these differences, the term development finance is often used to describe China’s international financial engagement, as it captures both concessional and non-concessional instruments. This thesis adopts a similar approach. The analysis distinguishes between ODA and OOF, while referring more broadly to Chinese financial flows as development finance.
Literature Review
This section reviews the existing literature in the field. It begins by explaining the motivations for foreign aid provision, to then examine aid allocation patterns and interactions between donors. It then examines the literature on China as a development financier. Finally, the motivation and contribution of this thesis are presented.
Motivations for foreign aid provision
To assess whether aid from one donor crowds in or crowds out aid from others, it is necessary to understand the underlying motivations for foreign aid. The economic literature on foreign aid allocation and donor interdependencies generally characterises foreign aid as a combination of altruistic, political, economic, and strategic motives (see e.g. Dreher et al., 2013; Alesina & Dollar, 2000; Gounder & Sen, 1999).
The most common view of foreign aid, as reflected by the OECD, is that its primary objective is to promote economic development, reduce poverty, and improve welfare in recipient countries (OECD, 2024). In this perspective, aid is presented as an altruistic instrument of foreign policy, aimed at addressing development needs and humanitarian concerns (Schraeder, Hook & Taylor, 1998). Empirical evidence provides some support for this view. For example, Gounder & Sen (1999) find that aid flows are negatively correlated with recipient income and positively associated with population size, suggesting that donors respond to indicators of need. However, most of the existing economic literature finds little support that foreign aid is motivated by pure altruism. Instead, aid allocation is dictated by political and strategic considerations, with driving factors being colonial pasts and political alliances (Alesina & Dollar, 2000). Dreher et al. (2013) further support this view, drawing on Morgenthau (1962), who argues that foreign aid can be understood as “[…] a price paid for political services rendered,” highlighting its role as a foreign political strategy (Dreher et al., 2013, p. 158).
Consistent with this, Schraeder, Hook and Taylor (1998) find that aid allocation is largely driven by recipients’ strategic importance and economic potential, suggesting that aid is used as a tool to advance donors’ national interests, including security and trade. Similarly, Younas (2008) shows that donors allocate more aid to recipients who import goods in which donors have a comparative advantage, pointing to the importance of economic interests. Overall, donors’ self-interests on aid allocation decisions are largely discussed in the literature, and many scholars find similar patterns of trade relations, historical ties, and political alliances being driving factors (see e.g. Berthelémy & Tichit, 2004; Bandyopadhyay & Vermann, 2013).
Depending on the underlying motivations for aid provision, different mechanisms of donor interdependence may arise (Ferrière, 2022). Although empirical evidence suggests that altruistic motives are not dominant, the framework implies that aid from different donors may act as substitutes: an increase in aid from one donor reduces remaining need, prompting others to reallocate resources elsewhere. This suggests a crowding-out effect, as donors may seek to avoid duplicating efforts and instead direct resources to underfunded areas. This intuition is consistent with models that treat foreign aid as a public good. In such settings, increased contributions by one donor reduce the marginal benefit of giving for others, creating incentives to free ride and thereby generating a negative relationship between donors’ aid allocations (Mascarenhas & Sandler, 2006; Davies & Klasen, 2019).
In contrast, when aid is motivated by political, economic, or strategic interests, the allocation decisions of one donor can lead to either crowding-in or crowding-out effects. The direction of this response depends on the underlying motivations. Aid may become positively interdependent if donors compete for influence or use each other’s allocation decisions as signals of recipient importance. Conversely, if donors prioritise coordination and/or specialisation, increased aid from one donor may reduce the incentives for others to contribute, leading to crowding-out (Davies & Klasen, 2019).
Applied to Chinese development finance, these mechanisms imply ambiguous predictions. On the one hand, Chinese financing may crowd out DAC aid if DAC donors are primarily motivated by altruistic considerations or if they prioritise coordination or free riding. Increased Chinese financing may reduce the perceived need for external funding, leading DAC donors to reallocate resources elsewhere. It may on the other hand crowd in DAC aid if it signals strategic or economic importance, prompting DAC donors to respond competitively to China’s growing influence by increasing aid to the same countries or sectors.
The response may also differ across types of financial flows. As Chinese development finance largely consists of OOF, DAC donors may adjust their own non-concessional financing more strongly than their concessional aid. DAC responses are thus not necessarily uniform but depend on the underlying motivations for aid provision. The thesis tests the following hypotheses:
(H1): The effect of Chinese development finance on DAC aid allocation is ambiguous and may result in either crowding-in or crowding-out effects, depending on the underlying motivations guiding DAC donors.
(H2): The response to Chinese development finance differs across financial flow types, with potentially different effects for DAC ODA and DAC OOF.
Aid allocation and donor interaction
Building on the previous section, the economic literature has primarily focused on examining the determinants of foreign aid, while few studies have analysed the (strategic) interactions between donors. Davies & Klasen (2019) address this gap by analysing ODA from OECD donors using a fixed-effects panel regression. They find evidence of a positive interdependence, with increases in aid from other donors leading to significant increases in aid from a given donor, indicating crowding-in effects. This pattern is attributed to information-driven herding, whereby donors follow others’ allocation decisions under uncertainty.
Other studies highlight that donor responses may be heterogeneous. Ferrière (2022) exploits a policy reform in EU food aid allocation as an exogenous shock to analyse how other donors react. The study finds that EU food aid generally crowds in food aid from other donors. However, responses differ across donors: European countries tend to increase their aid, while the United States and the World Food Programme (WFP) reduce theirs, suggesting the coexistence of both crowding-in and crowding-out effects.
Further evidence suggests that donor interaction may be driven by strategic economic interests, particularly by competition for export markets. Barthel et al. (2014) analyse how OECD DAC donors adjust their aid allocation in response to other donors when competing for similar export destinations. They find a positive spatial interdependence, particularly among large donors, who increase aid to recipient countries that are key export markets and already receive support from competing donors. Importantly, these crowding-in effects are highly sector specific, being most pronounced in economic infrastructure and production sectors, where aid is closely linked to trade and commercial interests. There is also weaker evidence for a crowding-out effect in “softer” sectors (e.g., education, health) from more altruistic donors (mostly the Nordics), who appear to prioritise coordination and specialisation rather than competition. These findings suggest that donor interactions are heterogeneous across donors, sectors, and motivations.
Several studies find evidence of positive donor interdependence and herding behaviour in aid allocation. Donors tend to move together in their aid allocation decisions by simultaneously increasing or decreasing aid to the same recipient countries. This suggests that aid allocations may act as strategic complements consistent with a crowding-in effects (Frot & Santiso, 2011; Powell & Bobba, 2006). Such behaviour is discussed as a “[…] fear of being left out and missing some future investment or diplomatic opportunities” (Frot & Santiso, 2011, p. 18). Donor interaction may also depend on how impact is evaluated. If donors prioritise relative rather than absolute impact, this may increase competition and fragment aid allocation. In this context, the rise of emerging donors such as China may reinforce competitive behaviour and reduce coordination (Annen & Moers, 2012).
China’s role in international development cooperation
As a result of China’s expanding engagement in Africa, much of the literature on Chinese development finance is concentrated on the continent. The literature primarily examines the economic effects of Chinese development finance in recipient countries, and how it differs from traditional Western aid. For example, Gilpin (2023) finds that China’s engagement in Africa challenges the international aid system by providing an alternative to Western aid. This increases recipients’ bargaining power and reduces the influence of traditional donors. Furthermore, Dreher et al. (2021) analyse Chinese development finance to 138 recipient countries between 2000 and 2014, examining its effects on economic growth and whether it undermines the effectiveness of Western aid. In line with my thesis, they treat OECD DAC donors as a collective group. Their results show that Chinese development finance increases short-term economic growth and does not undermine the effectiveness of Western aid, although US aid appears to be more effective in countries with less Chinese presence.
However, despite a growing body of research on Chinese development finance, relatively little attention has been paid to how traditional donors respond in their aid allocation decisions. In a policy analysis, Rudyak (2025) analyses the implications of China’s development finance for the EU and Sweden, arguing that African countries increasingly favour China’s partnership-based approach over European conditionality. The study highlights that China addresses a demand for infrastructure in developing countries where European financing has been absent. Rudyak emphasises that “ many Global South actors do not view China and the EU as competitors but as complementary: China providing ‘hard’ infrastructure and Europe having a strong track record in delivering ‘soft’ infrastructure” (Rudyak, 2025, p.106). This shift has pushed European donors to reconsider their development strategies, particularly through initiatives such as the EU’s Global Gateway, which focuses on infrastructure and innovation and is often framed as a response to the BRI.
Although not focused on China, Perrotta Berlin (2025) contributes to the broader discussion of how development aid intersects with foreign and security policy. The study analyses Western donors’ responses to Russia’s engagement in Africa using a DiD framework, similar to the one adopted in this thesis. The results show heterogeneous donor responses: some donors withdraw from contested areas, while others adapt or intensify their aid allocation, highlight the influence of geopolitical considerations. A similar dynamic may be expected to China’s growing presence in Africa, which may trigger heterogeneous and potentially strategic responses from DAC donors shaped by geopolitical considerations.
Contribution
As highlighted in the previous literature, most studies focus on interactions among traditional donors, with limited evidence on how they respond to emerging donors like China. This research gap is important given that China differs from traditional donors in both the composition and strategic orientation of its development finance.
This paper contributes to the relatively limited literature on donor interactions by providing new empirical evidence on how DAC donors respond to Chinese development finance. In doing so, it also adds to the growing body of research on China’s emerging role in the landscape of international development cooperation. More specifically, the study distinguishes between DAC responses through ODA and OOF, providing evidence on whether China’s growing presence in Africa is associated with changes in both the level and composition of DAC development finance. This topic is particularly relevant in a context where traditional donors are scaling back their foreign aid, with notable examples such as the dismantling of USAID’s activities in 2025. Meanwhile, Chinese development finance is reshaping both the composition of aid and the nature of donor-recipient relationships, increasingly framed as partnerships rather than traditional aid provision. The results may be relevant for Sweden and other DAC donors by informing broader policy discussions about aid strategies in this evolving landscape, including the composition of development finance and the role of coordination versus strategic competition.
Methodologically, this thesis contributes to the literature by applying a DiD framework to analyse donor interaction. While previous studies have primarily used panel regressions with fixed effects, this thesis exploits a defined policy change related to the expansion of Chinese development finance. This allows for a more credible identification of causal effects, as the variation is driven by China’s political and strategic objectives, and not necessarily by recipient countries’ underlying needs. By doing so, the analysis complements existing empirical approaches and provides new insights into how donor behaviour responds to external shocks.
Data
This study uses panel data covering development finance to 56 African countries over the period 2000–2021. Financial flows are disaggregated by donor group, with a distinction between China and member countries of the DAC, a total of 34 donor countries. Financial flows are further classified into ODA and OOF. The data is disaggregated by sector according to the OECD sector classification. The dataset contains 29 sectors. Combining the recipient country, donor country, sector, and year dimension yields a total of 178 631 observations. Regional projects not assigned to a specific recipient country (e.g., “Africa, regional” or “Eastern Africa, regional”) are excluded. The sample is further restricted to aid provided by DAC members. Observations on aid flows from multilateral organisations, foundations, or other non-DAC entities are therefore removed. Lists of recipient countries, sector classifications, and DAC donors are provided in tables A1, A2, and A3 in the Appendix.
Chinese development finance to Africa expanded following the launch of the BRI, with average annual flows approximately doubling in the post-2013 period (see Appendix, Table A4). To illustrate the evolution over time, Figure 1 presents total development finance to Africa from DAC donors and China over the period 2000–2021.
Figure 1. Development Finance to Africa (DAC donors & China), 2000–2021
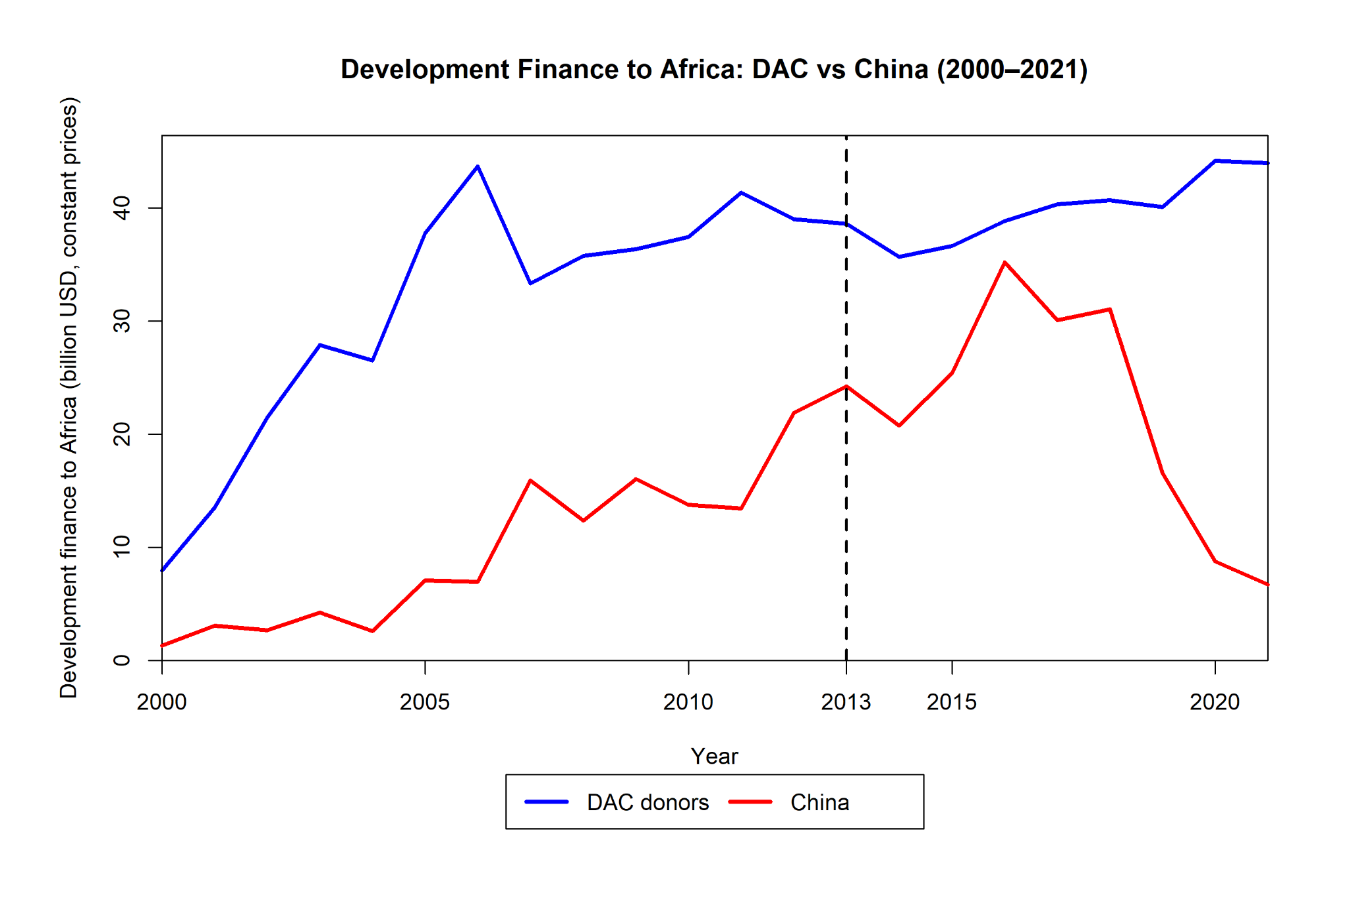
Notes: The figure displays total DAC and Chinese development finance to Africa, aggregated across recipient countries and sectors, 2000–2021. Values are expressed in USD billions. Source: OECD CRS and AidData.
The figure shows that DAC aid remains consistently higher throughout the period, with a relatively stable upward trend and some fluctuations over time. In contrast, Chinese development finance starts from lower levels but increases during the early 2010s, suggesting that the expansion associated with the BRI builds on an existing upward trend rather than representing a sharp break. Following 2013, Chinese development finance continues to increase and fluctuate at relatively high levels before declining in the later years of the sample, particularly after 2018. This decline may reflect broader global factors, such as the effects of the COVID-19 pandemic. Overall, the figure highlights both the rapid growth of Chinese development finance and its increasing importance relative to traditional DAC flows over time.
Dependent variable – ODA and OOF from DAC donors
The data on aid and other official flows from DAC donor countries are obtained from the OECD Data Explorer, using the Creditor Reporting System (CRS). It is widely used in the research literature and serves as a reliable source for statistical analysis of international aid and cross-country comparisons. A key advantage of the CRS is its high level of disaggregation, making it possible to analyse aid flows across donors, recipients, sectors, and time. Aid activities in the CRS are classified using sector codes, which group flows into broad development sectors (e.g. agriculture, education, infrastructure).
The CRS dataset includes different categories of financial flows; ODA (1 102 652 observations), OOF (7680 observations) and Private Development Finance (146 observations). The latter are financial flows financed by civil society organisations. For the purposes of this study, I focus on development finance provided by governments. The sample is therefore restricted to ODA and OOF flows. The distinction between ODA and OOF allows the analysis to separately examine the effects on concessional aid and non-concessional flows.
Figure 2 presents the composition of development finance from DAC-donors to Africa across the two flow types over the observed period. The figure shows that most financial flows are provided in the form of concessional aid, while OOF constitutes a relatively small share of total flows. Although OOF are small compared to ODA, it exhibits some variation over time, with fluctuations in certain periods such as around 2005 and in the years following 2013.
Figure 2. DAC-donor’s Development Finance to Africa, 2000–2021
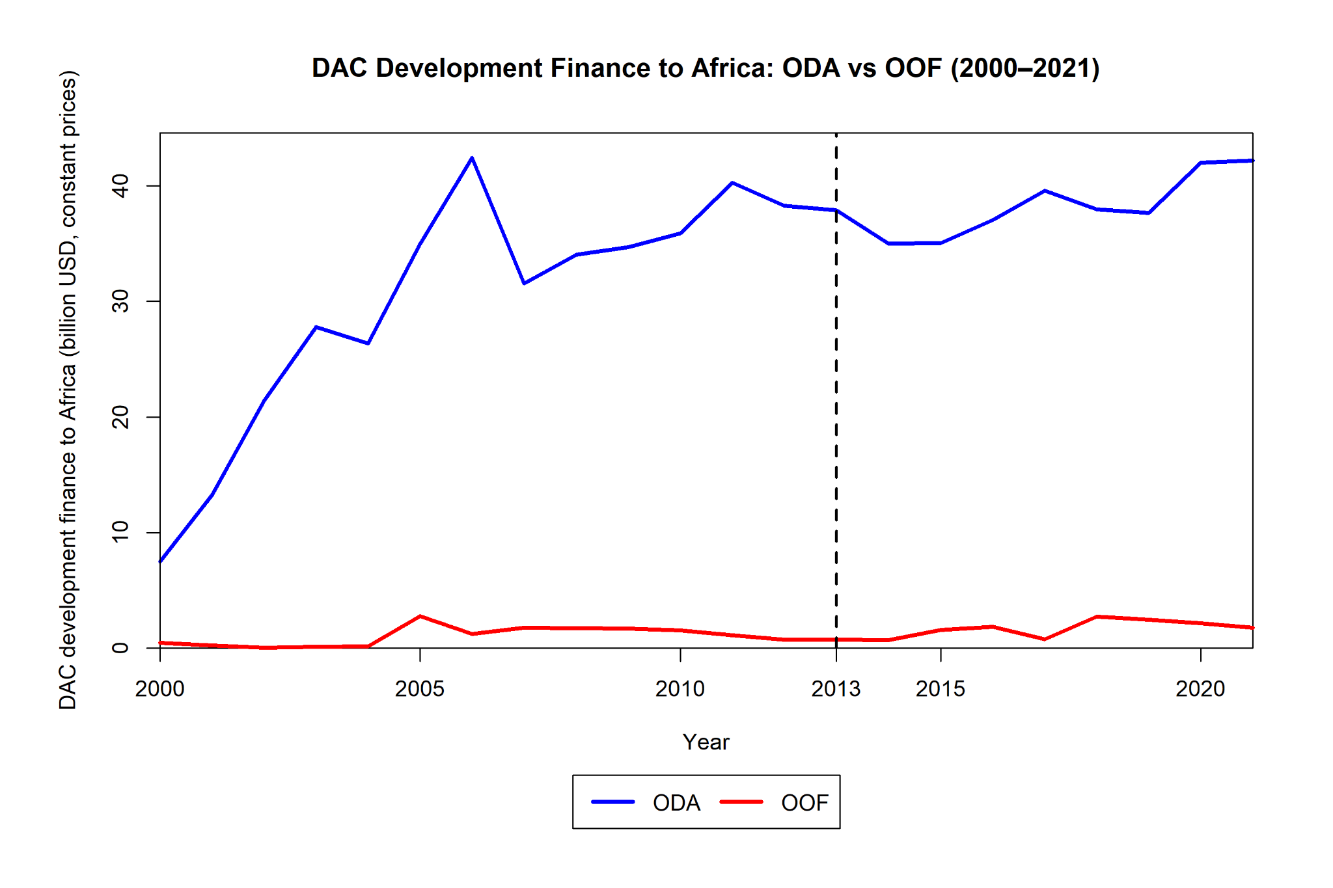
Notes: The figure displays total DAC development finance to Africa by flow type (ODA and OOF), aggregated across recipient countries and sectors over the period 2000–2021. Values are expressed in USD billions. Source: OECD CRS.
The amount of ODA/OOF from DAC donors is reported as both committed amounts and disbursed amounts. While commitments measure donors’ planned aid and give an indication about future flows, disbursements show actual payments made each year. The analysis will focus on disbursement as it records the actual transfer of funds each year rather than multi-year commitments which may not be fully realised. This is in line with existing literature (e.g. Davis & Klasen, 2019; Knack et al., 2014; Fuchs et al., 2014).
Disbursements are measured in constant USD (deflated) and expressed in USD millions for the reporting year. Using deflated amounts ensures comparability over time, allowing observed changes in aid flows to reflect real variation rather than changes in price levels. Some project-level observations in the raw data contain missing values for disbursements. However, as the analysis is conducted at the recipient-donor-sector-year level, aid flows are aggregated across projects. During this aggregation, missing values do not contribute to the total disbursements, and the resulting panel dataset contains no missing observations for the outcome variables.
Chinese development finance
China does not disclose detailed public information on its development finance and overseas activities. This lack of transparency can be attributed to several factors. First, China’s development finance is characterised by fragmented institutional responsibilities, involving 20–30 different ministries and their affiliated agencies, which complicates the collection and reporting of data. Second, financial flows are used as a strategic tool for foreign policy, and greater transparency could lead to competition among recipient countries and weaken China’s bargaining power. Third, there is a domestic opposition to using tax money for foreign aid as many people in China still live under the poverty line (Yuan et.al, 2022).
Many databases have therefore had to estimate the amount and the allocation of Chinese development finance through different open sources, media reports and governmental documents (Yuan et.al, 2022). This study uses AidData’s Global Chinese Development Finance Dataset, Version 3.0, published in 2023, which tracks project commitments between 2000 to 2021. The dataset includes sector classification which are aligned with the sector codes in the OECD CRS data, allowing for a comparison between the two. Further details on the construction of the dataset are provided in the Appendix.
Chinese development finance is measured using the adjusted amount expressed in constant 2021 USD. The adjusted amounts are converted from their original currency into nominal USD using exchange rates in the year of commitment and are then deflated to constant 2021 USD using the OECD’s deflation methodology (Custer et al., 2023). For most projects, the adjusted amount corresponds to the reported commitment value. However, for certain financial instruments, the same loan may be renewed over multiple years without new disbursements. To avoid counting the same disbursements more than once, AidData records an adjusted monetary amount only in the initial year of the commitment, while the amount is left missing in subsequent years. This measure is recommended by AidData for analysing Chinese development finance over time and is used as the main monetary indicator in this study.
It should be noted that this variable is based on financial commitments, whereas DAC flows are measured as actual disbursements. This difference in measurement will affect the interpretation of the results. In particular, the analysis captures how DAC donors respond to announced or planned Chinese financing commitments, rather than realised disbursements. Accordingly, the estimated effects should be interpreted as DAC responses to China’s intentions to expand future financial flows across countries and sectors. Moreover, differences in the base year used to deflate DAC donor flows and Chinese development finance do not affect the results, as they only change the scale of the variables and not the variation within each country-sector combination over time.
Some project-level observations in the AidData dataset lack reported monetary amounts. When aggregating the data, these observations do not contribute to the total amount, as only reported financial values are included in the aggregation. Following AidData’s recommended data handling procedures, the analysis excludes all observations labelled as “No” in the marking “recommended for aggregates” to avoid double counting financial flows and project counts in umbrella agreements, and to exclude projects that were cancelled or never reached the official commitment stage. In total, 1 333 observations are labelled as “No” while 7 886 are labelled “Yes”. Observations classified as “debt rescheduling” are also excluded, a total of 92 observations. AidData does not report consistent monetary values for these transactions, making them unsuitable for aggregation and comparison with other financial flows.
Based on OECD DAC guidelines, AidData has assigned projects to one of three categories: ODA-like (6 183 observations), OOF-like (1 340 observations) and Vague Official Finance (271 observations). The latter consists of projects that are backed by an official commitment but cannot be reliably categorised as ODA-like or OOF-like because of insufficiently detailed information (Custer et al., 2023). Following earlier literature (Dreher et al., 2017), these observations can be assumed to be OOF-like, as their attributes resemble those of OOF projects more than ODA projects. The Vague OF projects are therefore included in the OOF-like flow type, allowing for a clear distinction between Chinese ODA- and OOF-like finance, ensuring comparability with the OECD CRS data. AidData recommends using flow types for distinguishing between concessional and non-concessional aid, and for when comparing Chinese development finance to other development finance that are categorised according to OECD-DAC definition (Custer et al., 2023). Figure 3 present the composition of Chinese development finance across the two flow types over the observed period.
Figure 3. Chinese Development Finance to Africa, 2000–2021
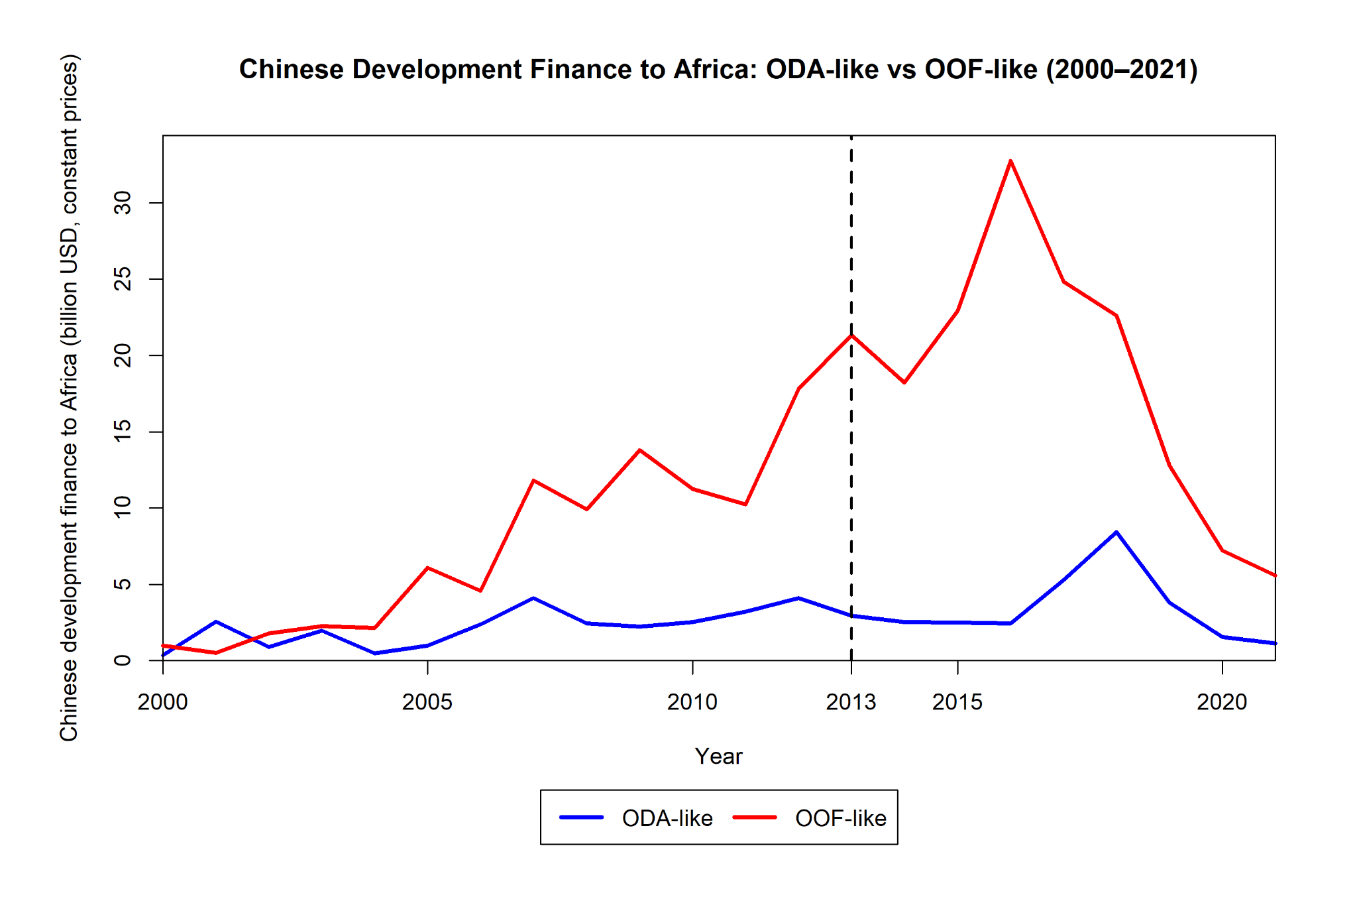
Notes: The figure displays total Chinese development finance to Africa by flow type (ODA-like and OOF-like), aggregated across recipient countries and sectors over the period 2000–2021. Values are expressed in USD billions. Source: AidData.
In contrast to DAC-donors, Chinese development finance is dominated by OOF-like flows, which constitute most of the total financing throughout the period. ODA-like flows remain relatively small and stable over time. OOF-like financing increases substantially from 2005 and onwards, reaching a peak in the mid-2010s, before declining in the later years of the sample. Table A5 in the Appendix further presents the share of ODA and OOF allocated to each sector for China and DAC donors, respectively. Table A6 (in Appendix) shows the top 10 sectors by growth in Chinese development finance, reinforcing the view that Chinese financing is concentrated in “hard” infrastructure sectors.
Table 1 presents summary statistics for the main variables used in the analysis at the recipient country-year level. It highlights the predominance of concessional aid in DAC financing, in contrast to the strong emphasis on non-concessional flows in Chinese development finance. The large standard deviations and wide ranges across all variables indicate heterogeneity in financial flows across countries and over time.
Table 1. Summary statistics
|
Variable |
Mean |
Std. Dev. |
Min |
Max |
N |
|
DAC ODA (USD million) |
610.3 |
787.66 |
0.880768 |
13001.51 |
1201 |
|
DAC OOF (USD million) |
23.92 |
88.29 |
0 |
1262.444 |
1201 |
|
China ODA (USD million) |
57.74 |
153.57 |
0 |
2752.294 |
1201 |
|
China OOF (USD million) |
255.9 |
881.56 |
0 |
17967.76 |
1201 |
Notes: All values are expressed in USD millions. The unit of observation is recipient country-year.
Construction of the treatment variable
As Chinese development finance in Africa is not evenly distributed across countries or sectors, defining treatment at the country or sector level alone would not capture important variation in exposure. China may concentrate its financing in specific sectors within a country, which would be masked by more aggregated measures.
To capture within-country variation in exposure, treatment is assigned to country-sector pairs with highest levels of exposure to Chinese development finance. The dataset contains 1497 unique country-sector pairs. For each pair, the average annual level of Chinese development finance (measured as the sum of Chinese ODA-like and OOF-like commitments) is calculated separately for the pre- and post-2013 periods. Exposure is defined as the change in average annual financing between these two periods, capturing the extent of the expansion in Chinese development finance following the launch of the BRI. A total of 112 pairs contained no observable Chinese development finance in either the pre- or post-2013 period, resulting in missing exposure growth measures. Excluding these cases leaves 1385 pairs with valid exposure measures. Country-sector pairs are then ranked according to the absolute increase in development financing, and treatment is assigned to the top 20 % of pairs in this distribution, corresponding to 277 treated country-sector pairs.
Table 2 presents the top 20 country-sector pairs ranked by growth in levels. It also presents the growth factor. Many pairs exhibit zero or very low levels of Chinese development finance in the pre-period, followed by large increases in the post-period. These changes are not well captured by relative growth measures, which are either undefined or misleading when initial values are close to zero. As a result, defining treatment based on growth factor would risk incorrectly classifying affected country-sector pairs as part of the control group. The level-based approach more effectively captures economically meaningful increases in Chinese development finance, rather than small relative changes from low baseline levels. As such, the preferred treatment focuses on large-scale expansions in Chinese financing and aligns closely with the underlying mechanism of potential competition between China and DAC donors.
Table 2. Top 20 country-sector pairs arranged by growth in levels
|
Country |
Sector |
Sector Name |
Pre 2013 |
Post 2013 |
Growth (levels) |
Growth (factor) |
|
AGO |
230 |
Energy |
535.16 |
1793.13 |
1257.97 |
2.35 |
|
AGO |
430 |
Other multisector |
215.48 |
953.78 |
738.30 |
3.43 |
|
ZAF |
230 |
Energy |
0.00 |
718.80 |
718.80 |
|
|
EGY |
240 |
Banking and financial services |
0.00 |
533.01 |
533.01 |
|
|
KEN |
210 |
Transport and storage |
53.06 |
577.81 |
524.75 |
9.89 |
|
AGO |
240 |
Banking and financial services |
0.00 |
497.93 |
497.93 |
|
|
NGA |
230 |
Energy |
26.92 |
508.69 |
481.77 |
17.90 |
|
NGA |
210 |
Transport and storage |
92.79 |
530.75 |
437.96 |
4.72 |
|
ETH |
320 |
Industry, mining, construction |
68.36 |
501.11 |
432.76 |
6.33 |
|
GIN |
230 |
Energy |
0.75 |
400.57 |
399.82 |
535.90 |
|
ZMB |
210 |
Transport and storage |
33.62 |
407.77 |
374.16 |
11.13 |
|
ZAF |
210 |
Transport and storage |
0.00 |
344.79 |
344.79 |
|
|
ETH |
210 |
Transport and storage |
81.47 |
398.54 |
317.07 |
3.89 |
|
EGY |
320 |
Industry, mining, construction |
38.21 |
352.09 |
313.88 |
8.22 |
|
ZMB |
230 |
Energy |
64.20 |
345.92 |
281.72 |
4.39 |
|
CIV |
210 |
Transport and storage |
12.83 |
286.69 |
273.86 |
21.34 |
|
AGO |
210 |
Transport and storage |
387.74 |
641.91 |
254.17 |
0.66 |
|
UGA |
230 |
Energy |
0.17 |
230.78 |
230.62 |
1394.08 |
|
SEN |
210 |
Transport and storage |
10.93 |
216.33 |
205.40 |
18.79 |
|
MOZ |
320 |
Industry, mining, construction |
10.83 |
206.87 |
196.04 |
18.10 |
Notes: Variables are expressed in USD millions.
Treatment is defined as the top 20 % of country-sector pairs with the largest absolute increases in Chinese financing. This threshold reflects a balance between precision and statistical power. Higher cutoffs (e.g. 25 %) include more observations but risk capturing less exposed pairs, while lower cutoffs (e.g. 15 % or 10 %) focus on more strongly affected pairs but reduce the sample size and increase estimation noise. The 20 % threshold is therefore used as the baseline definition, while alternative cutoffs are included as robustness checks.
Table 3 illustrates the sectoral composition of the treatment group. Treated country-sector pairs are heavily concentrated in infrastructure-related sectors and are closely aligned with the strategic focus of the BRI. Sectors 230, 210, and 320 alone account for roughly 65 % of total growth amongst the treated pairs. Including banking and financial services and communications further reinforces that treatment primarily captures expansion in sectors associated with large-scale Chinese financing. The descriptive evidence thus confirms that the expansion of Chinese development finance post 2013 was concentrated in infrastructure sectors.
Table 3. Sectors in the treatment group (top 20 % of growth in levels)
|
Sector code |
Sector name |
Total growth |
Share of growth (%) of treated pairs |
Number of treated pairs |
|
230 |
Energy |
4335.20 |
27.10 |
27 |
|
210 |
Transport and storage |
3955.60 |
24.70 |
28 |
|
320 |
Industry, mining, construction |
2049.50 |
12.80 |
24 |
|
240 |
Banking and financial services |
1141.50 |
7.10 |
7 |
|
430 |
Other multisector |
900.10 |
5.60 |
7 |
|
220 |
Communications |
853.90 |
5.30 |
25 |
|
140 |
Water supply and sanitation |
499.70 |
3.10 |
17 |
|
310 |
Agriculture, forestry, fishing |
313.20 |
2.00 |
11 |
|
160 |
Other social infrastructure and services |
295.50 |
1.80 |
20 |
|
150 |
Government and civil society |
295.10 |
1.80 |
17 |
|
110 |
Education |
283.00 |
1.80 |
20 |
|
250 |
Business and other services |
253.60 |
1.60 |
9 |
|
998 |
Unallocated/unspecified |
246.60 |
1.50 |
10 |
|
510 |
General budget support |
222.30 |
1.40 |
3 |
|
120 |
Health |
211.60 |
1.30 |
25 |
|
330 |
Trade policies and regulations |
53.30 |
0.30 |
5 |
|
720 |
Emergency response |
47.10 |
0.30 |
9 |
|
600 |
Action relating to debt |
39.00 |
0.20 |
5 |
|
520 |
Developmental food aid/food security assistance |
14.10 |
0.10 |
6 |
|
730 |
Reconstruction relief and rehabilitation |
9.90 |
0.10 |
1 |
|
410 |
General environmental protection |
5.30 |
0.00 |
1 |
Notes: Total growth is expressed in USD millions.
Empirical Strategy
In this section, the empirical identification strategy is presented followed by the specifications and the model’s key identifying assumptions. After this follows an explanation of the robustness checks used to assess its validity.
Identification strategy
The empirical strategy will be conducted through a difference-in-differences (DiD) analysis estimated with two-way fixed effects (TWFE). With this strategy, this paper examines whether the expansion of Chinese development finance, following the launch of the BRI in 2013, affected the allocation of development finance by DAC donors in Africa. The study exploits the BRI as a plausibly exogenous, politically driven shock originating from China. Because the initiative was announced and implemented by the Chinese government, rather than as a response to changes in Western aid allocation, it provides plausibly exogenous variation in the timing of Chinese engagement across sectors and countries.
In a standard DiD-design, there is a treatment group that has been assigned treatment and a control group that has not. In such a setting, the treatment effect is identified by comparing changes in outcomes before and after the intervention between these two groups. The key identifying assumption is the parallel trend assumption (PTA), which requires that the treatment and control groups would have followed similar trends over time in the absence of treatment. Under this assumption, the model estimates an average treatment effect (ATE) of the intervention by comparing the differences in the outcome of the treatment group with the counterfactual outcome of the control group (Baker et al., 2025).[2]
In this study, however, units differ in their exposure to Chinese development finance, both before and after 2013. All countries and all sectors are potentially affected by the global expansion of China’s BRI, but some are more heavily exposed than others. Although Chinese engagement varies continuously across both countries and sectors, the empirical strategy classifies units into highly exposed and less exposed groups based on the growth in Chinese development finance post-2013. Treatment is therefore defined in binary terms at the country-sector level, allowing for a standard DiD framework, comparing changes in DAC ODA/OOF before and after 2013 between more and less exposed country-sector pairs. The key source of identifying variation is the differential intensity of Chinese engagement across sectors within countries following the launch of the BRI.
Consequently, this setup allows me to estimate the average treatment effect on the treated (ATT). The estimated coefficient from the DiD model captures the average change in DAC ODA/OOF flows in highly exposed country-sector pairs, relative to less exposed observations, after the launch of the BRI. Under the PTA, this estimate can be interpreted as the causal effect of differential exposure to Chinese development finance on DAC-donors’ allocation of ODA and OOF.
While TWFE is a common approach in applied economics, recent research has highlighted several limitations in settings with heterogeneous treatment effects or non-binary treatments. In such contexts, the TWFE estimators may produce biased or misleading estimates (see e.g. Baker et al., 2025; Goodman-Bacon, 2021; de Chaisemartin & D’Haultfoeuille, 2022).[3] However, these concerns are not relevant in this study. The empirical strategy exploits a single common treatment timing given by the launch of the BRI, which avoids biases associated with staggered treatment adoption. In addition, treatment is defined in binary terms, which simplifies the estimation, although the underlying variation in exposure remains continuous. The use of TWFE in this thesis is further motivated by its precedent in the aid allocation literature.
Baseline DiD specification
The baseline specifications of the DiD model are given by:
Where . To distinguish between concessional and non-concessional aid responses by DAC donors, the model is estimated separately for two outcome variables and . The outcome variable denotes DAC disbursements, expressed in millions of USD, from donor d, to recipient r in sector s and in year t. measure ODA disbursement while measures OOF disbursements. Estimating the model separately allows for testing whether DAC donors respond through concessional aid or through non-concessional financial instruments.
The difference between (1) and (2) lies in the fixed effects. Specification (1) includes country-sector pair fixed effects, denoted by while specification (2) includes separate fixed effects for recipient country, , and sector, . Year fixed effects are captured by , donor fixed effects are captured by , and is the error term. The fixed effects absorb time-invariant heterogeneity across recipients, donors, and sectors, while year fixed effects capture global shocks and common trends in aid allocation over time. Standard errors are clustered two-way at the recipient country and sector levels to account for within-cluster correlation in the error term, which could otherwise bias standard errors downward.
The inclusion of country-sector pair fixed effects in specification (1) implies that the treatment effect is identified from changes within each country-sector combination over time. In this specification, the estimated effect reflects how aid allocation in highly exposed country-sector pairs evolves relative to less exposed pairs. In other words, the model compares how aid evolves across country-sector combinations over time, rather than across countries within the same sector or across sectors within the same country. For example, it tracks how aid to Kenya’s infrastructure sector changes over time and compares this to changes in other country-sector combinations, such as Angola’s infrastructure sector or Kenya’s health sector.
In contrast, specification (2) controls for recipient-specific and sector-specific factors separately, but not for their interaction. This allows for more variation in the data but does not account for fixed differences unique to each country-sector combination. As a result, this less restrictive specification may ignore important differences between specific country-sector combinations, which may lead to less precise estimates and omitted variable bias if such pair-specific factors are relevant.
is a dummy variable equal to 1 for observations of country-sector pairs that are classified as treated. Hence if the observation belongs to the top 20 % of the distribution of exposure to Chinese development finance, measured as the change in average annual financing between the pre- and post-2013 periods. All else is equal to 0. is a dummy equal to 1 for years t 2013. The interaction therefore takes the value 1 for treated country-sector pairs in the post-2013 period, and 0 otherwise. The coefficient of interest, β, captures the average change in DAC ODA/OOF allocation within treated pairs after the launch of the BRI. Under the PTA, this coefficient identifies the ATT.
Parallel trend assumption and event study
The key identifying assumption of the DiD framework is the PTA, requiring that treated and control observations would have followed parallel trends in their outcome over time in the absence of treatment. In this setting, the assumption implies that country-sector pairs with higher exposure to Chinese development finance post 2013 would have followed similar trends in DAC ODA/OOF allocation as those pairs with lower exposure, had the BRI not taken place.
To assess the PTA and to examine the dynamic effects of Chinese development finance on DAC aid allocation, this study estimates an event study specification. This approach allows the treatment effect to vary across time relative to the launch of the BRI in 2013 and makes it possible to visually inspect whether treated and control units followed parallel trends prior to the treatment period. The specification is:
is an event-time indicator defined as , where 2013 is the first year of the BRI. I omit k = – 1 (year 2012) to avoid perfect multicollinearity. This means that k = 0 corresponds to 2013, k = +1 for 2014 and k = +2 for 2015 (these are lags), while k = – 2 for 2011, k = – 3 for 2010 (leads). Thus, each coefficient of measures the treatment effect in year k, relative to 2012. Evidence in favour of parallel trends is provided if the leads coefficients k < 0 are close to zero, statistically insignificant, and do not exhibit systematic pre-treatment trends. All other variables are defined as in the baseline DiD specification (1). Standard errors are clustered two-way at the recipient country and sector levels.
First-stage regression
Another important requirement for the empirical strategy is that the treatment must capture meaningful exposure to Chinese development finance following the launch of BRI in 2013. To assess this, the analysis includes a first-stage regression where the outcome variable is Chinese development finance. The purpose of this estimation is to verify that treated country-sector pairs indeed experienced a relative increase in Chinese development financing after 2013, and that the timing of these changes aligns with the introduction of the BRI. The first stage thus examines how Chinese development finance evolves in treated sectors pre and post 2013. If the results show a clear increase in Chinese financing for treated country-sector pairs around 2013, this supports the validity of the identification strategy. Conversely, if no such increase is observed, the treatment variable may fail to capture meaningful exposure to Chinese development finance, thereby weakening the interpretation of the main results.
The specification follows the same treatment definition as in the main analysis, where treatment is defined as the top 20 % of country-sector pairs in terms of growth in Chinese development finance in levels. The model includes country-sector pair fixed effects and year fixed effects. The standard errors are clustered two-way at the recipient country and sector levels. The outcome variable is Chinese development finance, measured separately for ODA- and OOF-like flows. The specification is:
Where . The coefficient estimates the effect on Chinese development finance in treated country-sector pairs in year k, relative to 2012. An increase in the post-treatment period would indicate that the treatment variable successfully captures exposure to Chinese development finance, thereby strengthening the credibility of the empirical design. All other variables are the same as in the event study specification in (3).
Robustness checks
To assess the robustness of the results, several alternative specifications are estimated. First, I vary the threshold used to define treatment. In the baseline specification, treatment is defined as the top 20 % of country-sector pairs by growth in Chinese development finance. To ensure that the results are not driven by this particular cutoff, I re-estimate the model using alternative thresholds corresponding to the top 25, 15, and 10 % of exposed country-sector pairs. Consistent results across these alternative definitions supports the validity of the treatment measure and indicates that the results are not sensitive to the specific threshold choice.
Second, I examine the sensitivity of the results to different clustering strategies. While the baseline specification employs two-way clustering at the recipient country and sector levels, I also estimate models with only clustering at the recipient level and only at the sector level. This allows for assessing whether the statistical significance of the results depends on the assumed correlation structure of the error term. Finally, I re-estimate the main specification (1) using the logarithm of the outcome variable. This transformation allows the coefficients to be interpreted in percentage terms. Consistent results across levels and logarithmic specifications would further strengthen the robustness of the findings.
Results
This section presents the results of the empirical analysis. It begins with the first-stage results, followed by the main findings from the baseline DiD specifications and the event study analysis. The section concludes with a robustness analysis of the treatment definition.
First stage
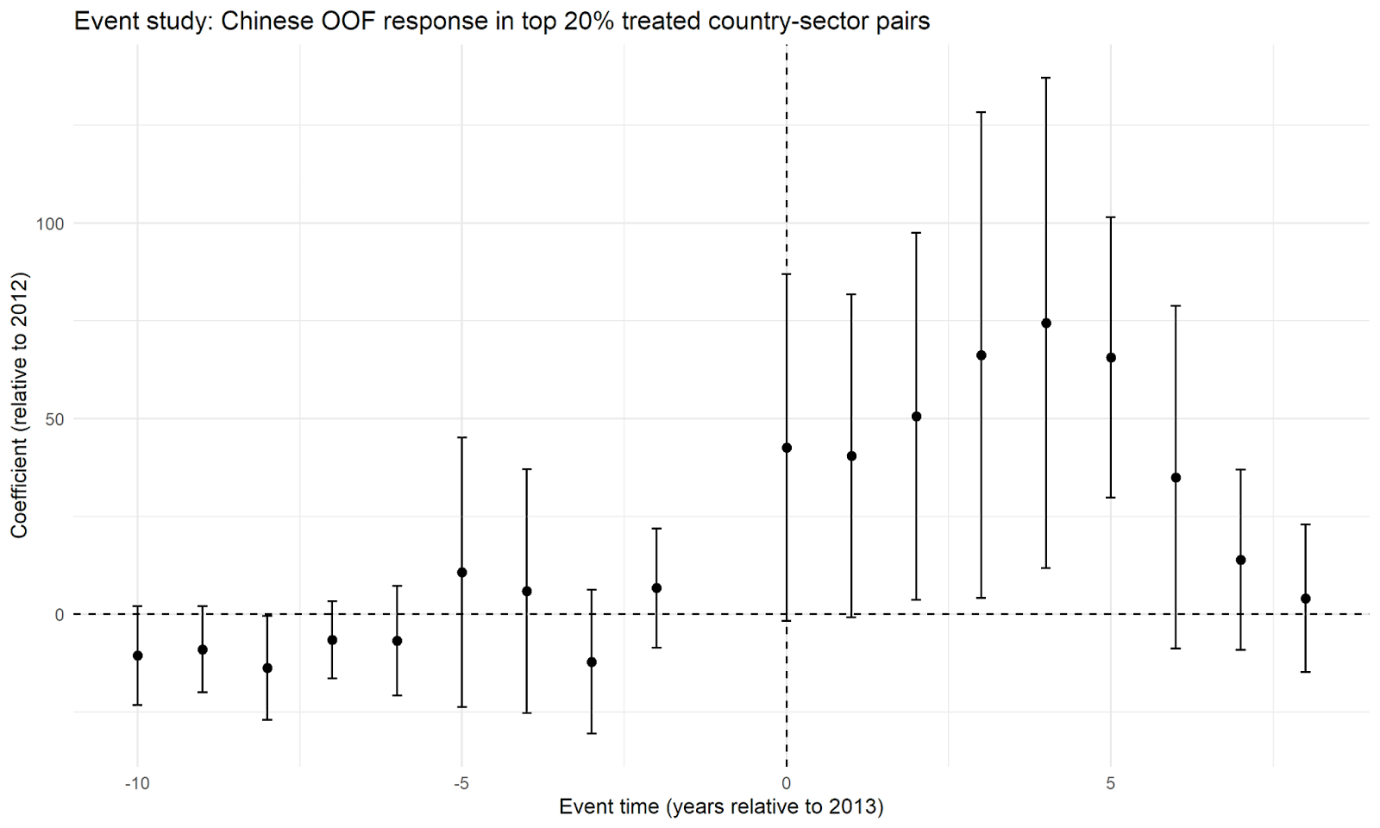
Figures 4 and 5 present the first-stage event study results for Chinese ODA and OOF. The first-stage results are important for the identification strategy, as they verify that the introduction of the BRI in 2013 led to a meaningful increase in Chinese development finance in treated pairs, rather than reflecting a continuation of pre-existing trends.
Figure 4. First stage: Chinese ODA-like response in treated country-sector pairs
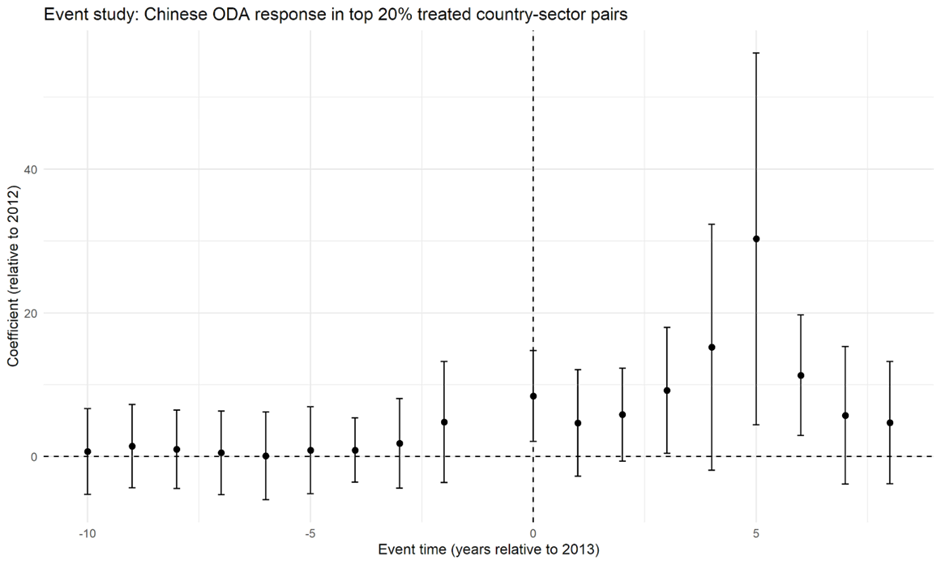
Figure 5. First stage: Chinese OOF-like response in treated country-sector pairs
Notes: The figures report event-study coefficients from specification (4). The omitted reference year is 2012. Error bars represent 95 % confidence intervals based on standard errors clustered two-way at the recipient country and sector levels.
Following the introduction of the BRI, Chinese development finance increases in treated country-sector pairs. The increase is particularly pronounced for OOF-like flows, which exhibit a sharp rise in 2013 and remain elevated with large estimated effects in the post-treatment period. ODA-like flows also increase in the post-treatment period, although the magnitude is smaller and the pattern is less consistent over time. Importantly, the timing of this increase appears relatively abrupt in 2013 in the treated pairs, especially for OOF-like flows. While Chinese development finance to Africa has already been increasing prior to 2013, the first-stage results indicate that this expansion was not concentrated in these specific country-sector pairs before the BRI, suggesting the presence of a structural break associated with its introduction.
The first-stage results confirm that the treated units experienced substantial increases in Chinese development finance following the introduction of the BRI, particularly in terms of non-concessional financing. This supports the validity of the treatment definition and empirical strategy, while also reinforcing the relevance of studying potential DAC donor responses.
For both ODA and OOF, the estimated coefficients in the pre-treatment period are relatively stable and close to zero. While there is some indication of a slight upward trend in OOF prior to 2013, the magnitude of these effects is limited. Overall, the figures provide no clear evidence of differential pre-trends between treated and control groups. While this does not constitute a formal test of the PTA for the main outcome variables, it provides supportive evidence that the treatment is not driven by existing pre-trends in Chinese development finance.
Main results
Table 4 presents the results from the baseline DiD specifications (1) and (2), including separate and pair fixed effects for DAC ODA and DAC OOF. It also includes the pre-treatment average of the outcome variable for the control group. This measure represents the counterfactual baseline and provides a benchmark for interpreting the magnitude of the estimated treatment effects. The pre-treatment averages, measured in USD millions, are 3.94 for DAC ODA and 0.138 for DAC OOF.
Table 4. DiD-results with separate and pair fixed effects
|
ODA (Separate FE) |
ODA (Pair FE) |
OOF (Separate FE) |
OOF (Pair FE) | |
|
Treatment × Post |
0.918 (0.759) |
0.658 (0.511) |
0.244 (0.164) |
0.229*** (0.072) |
|
Pre-treatment mean (control group) |
3.94 |
3.94 |
0.138 |
0.138 |
|
Number of observations |
178631 |
178631 |
178631 |
178631 |
|
R2 |
0.060 |
0.165 |
0.008 |
0.024 |
|
R2 Adj. |
0.059 |
0.157 |
0.008 |
0.016 |
|
Recipient FE |
Yes |
No |
Yes |
No |
|
Sector FE |
Yes |
No |
Yes |
No |
|
Recipient × Sector FE |
No |
Yes |
No |
Yes |
|
Donor FE |
Yes |
Yes |
Yes |
Yes |
|
Year FE |
Yes |
Yes |
Yes |
Yes |
Notes: Coefficients are reported in USD millions. Standard errors, reported in parentheses, are clustered two-way at the recipient country and sector levels. The pre-treatment mean refers to the average outcome value for the control group in the pre-2013 period. * p < 0.10, ** p < 0.05, *** p < 0.01
The estimated treatment effects for DAC ODA are not statistically significant under either the separate or pair fixed effects specifications, suggesting that there is no evidence that DAC donors systematically increase their concessional aid in country-sector pairs where Chinese development finance has expanded most since 2013.
The estimated coefficients for DAC OOF are similar in magnitudes across specifications with separate and country-sector pair fixed effects. However, the results become statistically significant only when pair fixed effects are included. This suggests that the difference between the specifications lies in the precision of the estimates rather than in the size of the effect. Country-sector pair fixed effects control for time-invariant characteristics specific to each country-sector combination, capturing the interaction between countries and sectors. This implies that certain sectors may be particularly relevant in specific countries, and failing to account for this heterogeneity may leave residual variation in the error term. By controlling for this source of variation, pair fixed effects lead to more precise estimates and smaller standard errors. As a result, the increased precision under this more restrictive specification yields a statistically significant treatment effect. In contrast, the specification with separate fixed effects does not account for differences between pairs, resulting in less precise estimates and a lack of statistical significance.
For DAC OOF, under the pair fixed effects specification, the estimated treatment effect is positive and statistically significant at the 1 % level. The estimated coefficient of 0.229 represents the average increase in DAC OOF (measured in USD millions) in treated country-sector pairs in the post-treatment period, relative to the control group. This indicates that non-concessional aid from DAC donors has increased in country-sector pairs where Chinese development finance expanded most following the introduction of the BRI.
In terms of magnitude, the estimated treatment effect is economically meaningful relative to pre-treatment levels. Comparing the estimated treatment effect for DAC OOF to the baseline of 0.138 USD million implies an increase of approximately 166 %. Even though the estimated coefficient for OOF flows is small in absolute terms, the relative response is large. In contrast, the estimated effect for DAC ODA correspond to an increase of around 17 % relative to the pre-treatment level. However, the lack of statistical significance implies that the estimated effect cannot be statistically distinguished from zero and should therefore be interpreted with caution. The results indicate that DAC donors adjust their non-concessional financing in response to increased Chinese development finance, particularly in sectors associated with large-scale infrastructure investment. Under the PTA, the estimated coefficient of 0.229 can be interpreted as a causal positive response in DAC OOF.
Figures 6 and 7 present the event study results for specification (3) and are used to assess the plausibility of the PTA. The pre-treatment coefficients are generally centred around zero for OOF and slightly below zero for ODA (relative to the omitted year 2012). They do not display any clear systematic pre-trends, suggesting that pairs in treatment and control group followed similar trends prior to the launch of the BRI, providing supporting evidence for the PTA. Following 2013, the estimated coefficients for DAC OOF become positive, indicating an increase in OOF financing in treated pairs in response to rising Chinese development finance. The effects on DAC ODA are not as large and remain statistically insignificant. While the post-treatment coefficients are somewhat noisy for both ODA and OOF, the overall pattern is consistent with the main DiD results.
Figure 6. Event study: dynamic treatment effects for DAC ODA
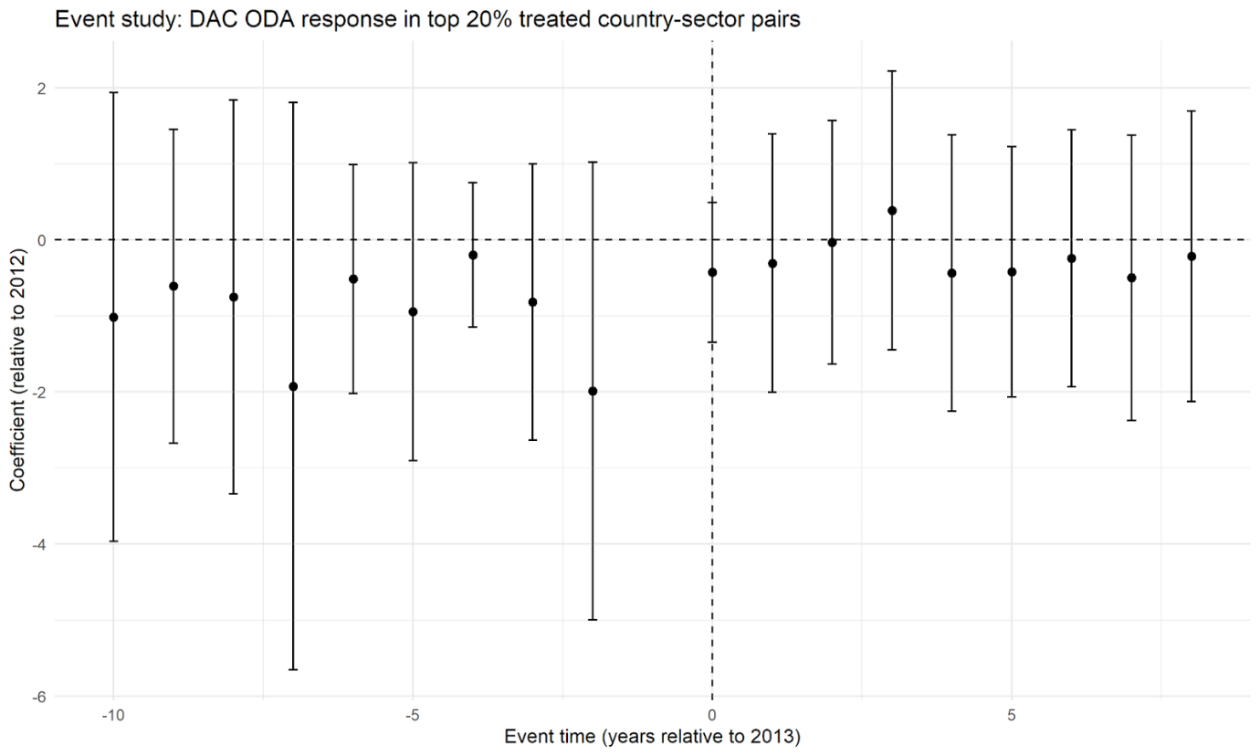
Figure 7. Event study: dynamic treatment effects for DAC OOF
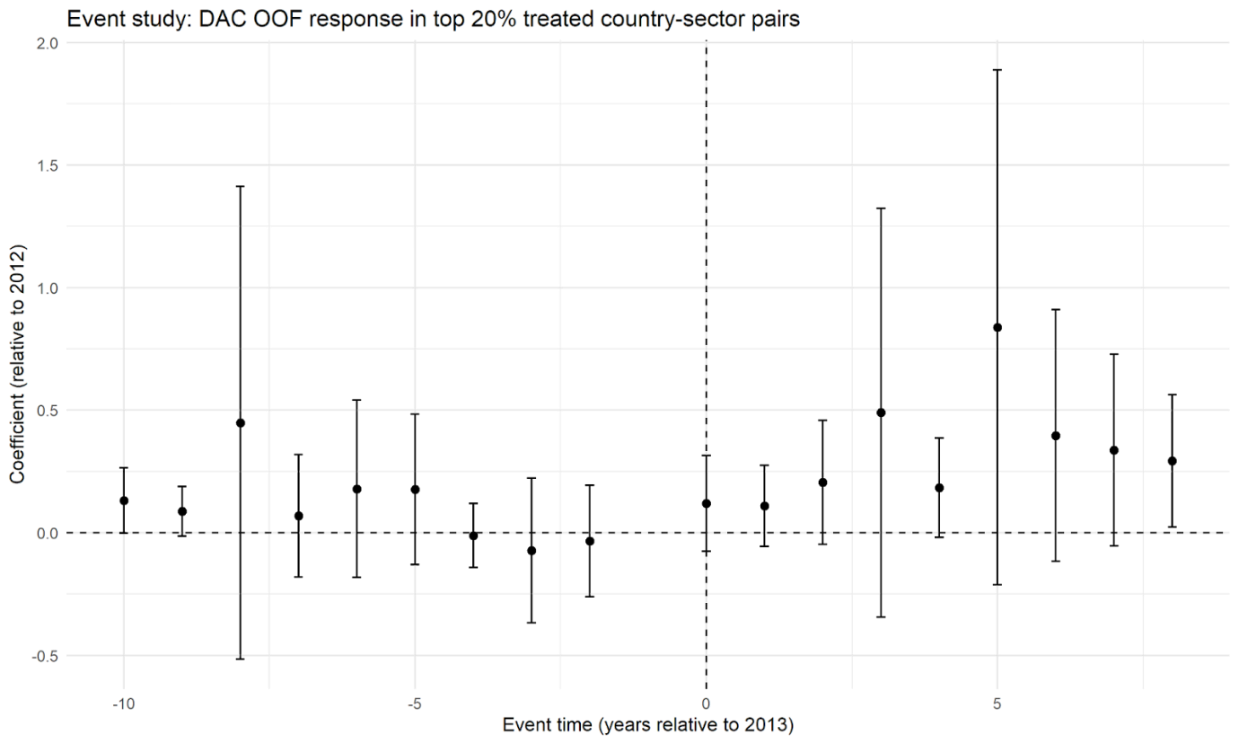
Notes: The figures report event-study coefficients from specification (3). The omitted reference year is 2012. Error bars represent 95 % confidence intervals based on standard errors clustered two-way at the recipient country and sector levels.
Different thresholds for treatment definition
To ensure that the results are not driven by the 20 % cutoff for treated pairs, the main specification (1) is re-estimated exploring alternative thresholds for defining treatment, corresponding to the top 25, 20, 15, and 10 % of exposed country-sector pairs. The results are presented in table 5.
Table 5. Results with different thresholds of treatment definition
|
Treatment definition |
Treatment effect: DAC ODA |
P-value (ODA) |
Treatment effect: DAC OOF |
P-value (OOF) |
N |
|
Top 25 % |
0.677 (0.603) |
0.27 |
0.184*** (0.033) |
0.00 |
178631 |
|
Top 20 % |
0.658 (0.511) |
0.21 |
0.229*** (0.072) |
0.00 |
178631 |
|
Top 15 % |
0.603 (0.479) |
0.22 |
0.298** (0.122) |
0.02 |
178631 |
|
Top 10 % |
0.133 (0.488) |
0.79 |
0.403** (0.192) |
0.04 |
178631 |
|
Pair FE |
Yes |
Yes |
Yes |
Yes |
Yes |
|
Donor FE |
Yes |
Yes |
Yes |
Yes |
Yes |
|
Year FE |
Yes |
Yes |
Yes |
Yes |
Yes |
Notes: Coefficients are reported in USD millions. Standard errors, reported in parentheses, are clustered two-way at the recipient country and sector levels. The specification includes country-sector pair fixed effects, donor fixed effects and year fixed effects. Treatment thresholds are based on growth in Chinese development finance between the pre- and post-2013 periods. * p < 0.10, ** p < 0.05, *** p < 0.01
The results indicate that DAC responses differ both by type of financial flow and by the intensity of exposure. For OOF flows, the estimated treatment effects increase in magnitude as the treatment definition becomes more restrictive and remain statistically significant across all thresholds. This pattern strengthens the conclusion that DAC donors respond through their non-concessional finance in country-sector pairs with higher exposure to Chinese financing. The larger coefficients at tighter thresholds suggest that the response is concentrated in the most affected country-sector pairs, which are predominantly infrastructure-related.
In contrast, the estimated treatment effects for DAC ODA are positive but statistically insignificant across all treatment definitions. While the magnitude of the coefficients remains relatively stable for the top 25–15 % thresholds, it declines at the most restrictive (top 10 %) threshold. This drop in magnitude likely reflects reduced precision due to the smaller number of treated observations. The lack of statistical significance across all thresholds indicates that concessional aid does not exhibit a systematic or targeted response to Chinese development financing.
Taken together, these findings highlight a clear difference in how DAC donors adjust different types of financial flows. The results suggest that competitive or strategic responses to Chinese financing are statistically significant for non-concessional flows, whereas the effect on concessional aid cannot be statistically distinguished from zero.
The results in table 5 also support the robustness of the treatment definition, as the estimated effects remain consistent across alternative thresholds. The top 20 % threshold provides a balance between capturing meaningful exposure and maintaining statistical precision. At this level, the estimated treatment effect in OOF is both economically meaningful and precisely estimated, while the sample size remains sufficiently large. I also re-estimate specification (1) using the logarithm of the outcome variable. The logarithmic specification yields similar results, supporting the robustness of the findings (see Appendix, Table A7). The results are also robust to clustering standard errors at different levels, consistently showing that the treatment effect is concentrated in OOF rather than ODA (see Appendix, Table A8). This strengthens the credibility of the findings as they are not sensitive to assumptions about the error term correlation.
Discussion
The results provide evidence of crowding-in rather than crowding-out effects. This suggests that DAC donors respond to Chinese development finance by increasing, rather than reducing, their own financial flows in countries and sectors where Chinese development finance has expanded the most. The findings are therefore consistent with the crowding-in mechanism outlined in the first hypothesis, H1. Moreover, the results support H2, indicating that DAC responses differ across financial flow types, with effects observed for DAC OOF rather than ODA. The results in this thesis align with previous found patterns of crowding-in effects, whereby aid from different donors tends to move together (e.g. Barthel et al., 2014; Davies & Klasen, 2019; Frot & Santiso, 2011).
Particularly striking is that the response from DAC donors occurs in non-concessional financial flows rather than in concessional aid, suggesting that DAC donors adjust their financial flows toward instruments more similar to Chinese development finance, such as loans and investments. The increase in OOF remains modest in absolute terms compared to ODA, which continues to dominate DAC flows to Africa (as shown in Figure 2 in the data section). However, the relative increase in OOF is substantial, indicating a broader shift in how DAC donors approach development cooperation.
The observed increase in DAC OOF in treated country-sector pairs may reflect strategic and geopolitical considerations in DAC donor behaviour. The effects are concentrated in infrastructure-related sectors, indicating that competition with China is most pronounced in “hard” sectors associated with economic and strategic interests. This pattern is consistent with Barthel et al. (2014), who find that donor responses are strongest in infrastructure and production sectors, reinforcing the view that donor interdependence is shaped not only by development objectives but also by economic and geopolitical incentives.
This pattern is consistent with recent policy initiatives such as the EU’s Global Gateway and the G7’s Partnership for Global Infrastructure and Investment, which place greater emphasis on infrastructure, investment, and strategic financing, suggesting a convergence toward more investment-driven development strategies. As stated by Rudyak (2025), “[…] the EU has yet to clarify whether the Global Gateway is a geopolitical instrument to counter the BRI, a genuine development initiative, or both” (Rudyak, 2025, p.110). This reflects the increasing strategic competition in infrastructure-investment between the EU and China.
As the Global Gateway was launched in 2021 (and the G7’s counterpart initiative in 2022) it is unlikely to have significantly affected the results of this study, as the data only extend up to that year. Future research could therefore examine whether the effects identified in this thesis have become more pronounced following the introduction of the Global Gateway, particularly in terms of DAC responses in OOF to Chinese development finance. Future research could also examine heterogeneity among DAC donors, as previous research has shown that donor behaviour differs systematically. Nordic countries tend to be more altruistic and focus more on coordination, while larger donors are more competitive (see e.g. Barthel et al. 2014; Alesina & Dollar, 2000). It would therefore be interesting to analyse whether this pattern also holds in responses to Chinese development finance.
From a policy perspective, these findings are relevant for Sweden and other DAC donors, as it raises important questions about the objectives of development cooperation. This concerns whether to prioritise concessional, poverty-oriented aid, or to use aid as an instrument for political and economic strategies by increasingly engaging in investment-driven and infrastructure-focused financing. From an altruistic perspective on aid provision, DAC donors would not be expected to concentrate resources in country-sector pairs already highly exposed to Chinese financing, but rather to direct aid to areas where needs are greater and financing gaps remain. In this sense, the findings point to a potential misalignment with needs-based allocation principles and suggest that greater coordination with China, rather than competition, could improve the overall effectiveness of development cooperation. This is particularly important in a context with the dismantling of USAID and where countries are scaling back their aid budgets. It further highlights the importance of ensuring that increasing strategic competition does not undermine the pursuit of long-term development goals. This is consistent with recent policy recommendations, emphasising the need for stronger coordination and dialogue between China and DAC donors to improve development outcomes and support progress toward the Sustainable Development Goals. (see e.g. Yuan et al., 2022; Oud & Almén, 2025).
The results are specific to Africa and may not be generalised to other developing regions. Countries in Asia, for example, have experienced different growth trajectories and may therefore exhibit different patterns of donor competition and strategic interaction between DAC donors and China. As a result, responses to Chinese development finance may differ across regional contexts, limiting the external validity of the findings. However, I would argue that the internal validity for Africa is relevant in itself, given the continent’s continued development needs and reliance on external financing and aid.
Some limitations of the analysis should be acknowledged. First, there are measurement differences between the data sources used. While DAC data are reported as disbursements, Chinese development finance from AidData is measured using commitments. As noted earlier, this does not invalidate the analysis but affects the interpretation of the results: the estimated effects capture how DAC donors adjust their disbursements in response to pledged Chinese financing. This distinction is unlikely to substantially affect the overall findings, as commitments and disbursements are highly correlated over multi-year periods, meaning that donors generally disburse the majority of what they promise. However, infrastructure projects often involve long implementation periods, meaning that annual commitments and annual disbursements may diverge in the short run. As a result, the estimated effects may not fully capture the timing of DAC donors’ responses. Given that the results of the study may suggest that DAC donor responses are driven by strategic or geopolitical considerations, using DAC commitments instead of disbursements could have been an interesting robustness check. If donors react to announced Chinese investments, commitments may better capture the timing of those responses.
Second, there is some uncertainty in the measurement of Chinese development finance. Ideally, official data from Chinese sources would be used, but such data are not publicly available. AidData represents the most comprehensive alternative and relies on a transparent methodology, compiling information from a wide range of sources. Moreover, the dataset is specifically constructed to be comparable with OECD CRS data, which strengthens its suitability for this type of analysis. Nevertheless, some measurement error cannot be ruled out.
A further limitation concerns the definition of the treatment group. In a standard difference-in-differences design, treatment status is typically determined independently of the treatment event itself. In this study, however, treatment is defined using realised post-2013 Chinese development finance. This choice reflects the nature of the research setting. Chinese development finance had already been increasing prior to the launch of the BRI, and African countries were exposed to Chinese development finance to varying degrees. As a result, there is no natural group of completely untreated observations. The challenge was therefore how to identify the country-sector pairs that were actually affected by the expansion in Chinese development finance. Defining treatment based on realised post-2013 exposure allows the analysis to identify the country-sector pairs where this expansion was most pronounced following the launch of the BRI. An advantage of this approach is that the treatment definition is closely aligned with the mechanism of interest, namely whether DAC donors respond differently in the country-sector pairs where Chinese development finance expanded the most. It also allows the analysis to exploit variation within countries, as Chinese development finance is often concentrated in specific sectors rather than being evenly distributed across all sectors of a recipient country.
At the same time, this approach implies that treatment is partly defined using post-treatment information, which raises the possibility that treated and control units differ in unobserved ways. The validity of the research design therefore relies on the assumption that the BRI generated the differential increase in Chinese development finance and that, absent the BRI, treated and control country-sector pairs would have followed similar trends. The event study and first-stage results provide supporting, although not definitive, evidence for this assumption.
Conclusion
The purpose of this thesis was to analyse how OECD DAC donors respond in their aid allocation to the expansion of Chinese development finance in Africa. More specifically, it asked whether Chinese development finance crowds in, crowds out, or alters the composition of ODA and/or OOF from DAC donors. To answer this question, the study applied a DiD-framework, exploiting the BRI in 2013 as a plausibly exogenous shock to Chinese development finance. The first-stage results strengthened the identification strategy by verifying that the launch of the BRI did indeed lead to a meaningful increase in Chinese development finance in treated pairs. The analysis relies on the identifying assumption that, in the absence of the BRI, treated and control units would have followed parallel trends in DAC ODA/OOF allocation. The event study analysis provides evidence for this assumption, and the results are robust across alternative treatment thresholds and model specifications.
The study shows that Chinese development finance does not crowd out DAC ODA/OOF. Instead, there is evidence of a crowding-in effect in OOF, while no significant response is found for concessional aid. The estimated treatment effect shows an average increase in DAC OOF of 0.229 USD million in country-sector pairs with high exposure to Chinese financing, hence primarily in infrastructure-related sectors. This corresponds to an increase of approximately 166 % relative to the pre-treatment baseline. These results suggest that DAC donors respond strategically to China’s growing engagement in Africa, primarily by expanding financial instruments that resemble Chinese development finance rather than increasing traditional aid.
These findings are consistent with a framework in which donor behaviour is shaped not only by development objectives but also by economic and geopolitical considerations. The results suggest a shift in the composition of development cooperation. Rather than reallocating concessional aid based on recipient needs, DAC donors appear to engage in investment-driven and commercially oriented financing, competing with China in infrastructural-sectors where strategic and economic interests are highly considered. From a policy perspective, these findings raise important questions about the future of international development cooperation. The increasing emphasis on non-concessional financing may imply a potential misalignment with needs-based allocation principles, particularly if resources are directed toward sectors already receiving substantial financing. This suggests that greater coordination between donors, including China, could improve the effectiveness of development cooperation and ensure that financial flows remain aligned with long-term development objectives.
Despite some limitations related to data measurements and transparency, as well as the identifying assumptions underlying the empirical strategy, the thesis provides new empirical evidence through a causal identification strategy on how traditional donors respond to an emerging development actor. It also contributes to research on China as a development financier. Future research could extend this analysis by examining more recent developments. This includes the introduction of the EU’s Global Gateway and the scaling back of traditional donors, which may have further strengthened the patterns identified in this thesis. It would also be valuable to explore heterogeneity across DAC donors, as responses may differ depending on donor. Such extensions would provide a deeper understanding of how geopolitical dynamics continue to shape the global system of development cooperation.
References
Alesina, A., Dollar, D. (2000). Who gives foreign aid to whom and why? Journal of Economic Growth, Vol. 5, no. 1, pp. 33–63.
Annen, K., Moers, L. (2012). Donor Competition for Aid Impact, and Aid Fragmentation. Working Paper. International Monetary Fund (IMF).
Baker, A., Callaway, B., Cunningham, S., Goodman-Bacon, A., Sant’Anna, P.H.C. (2025). Difference-in-Difference Designs: A Practitioner’s Guide. Available at: https://arxiv.org/pdf/2503.13323
Bandyopadhyay, S., Vermann, E.K. (2013). Donor motives for foreign aid, Review, Federal Reserve Bank of St. Louis, Vol. 95 (July), pp. 327–336.
Barthel, F., Neumayer, E., Nunnenkamp, P., Selaya, P. (2014). Competition for Export Markets and the Allocation of Foreign Aid: The Role of Spatial Dependence among Donor Countries, World Development, Vol. 64, pp. 350-365.
Berthélemy, J-C., Tichit, A. (2004). Bilateral donors’ aid allocation decisions—a three-dimensional panel analysis. International Review of Economics & Finance, Vol. 13, Issue 3, pp. 253-274.
Custer, S., Dreher, A., Elston, T.B., Escobar, B., Fedorochko, R., Fuchs, A., Ghose, S., Lin, J., Malik, A., Parks, B.C., Solomon, K., Strange, A., Tierney, M.J., Vlasto, L., Walsh, K., Wang, F., Zaleski, L., and Zhang, S. (2023). Tracking Chinese Development Finance: An Application of AidData’s TUFF 3.0 Methodology. Williamsburg, VA: AidData at William & Mary.
Davies, R.B & Klasen, S. (2019). Darlings and Orphans: Interactions across Donors in International Aid. Scandinavian Journal of Economics. Wiley Blackwell, Vol. 121, no. 1, pp. 243-277.
De Chaisemartin, C., D’Haultfoeuille, X. (2022). Two-way fixed effects and difference-in differences with heterogeneous treatment effects: a survey. National Bureau of Economic Research, Working Paper No. 29691. Available at: https://www.nber.org/system/files/working_papers/w29691/w29691.pdf
Dreher, A., Klasen, S., Raymond Vreeland, J., Werker, E. (2013). The Costs of Favoritism: Is Politically Driven Aid Less Effective? Economic Development and Cultural Change, Vol. 62, no. 1, pp. 157–91.
Dreher, A., Fuchs, A., Parks, B., Strange, A. M., & Tierney, M. J. (2017). Aid, China, and Growth: Evidence from a New Global Development Finance Dataset. AidData Working Paper #46. AidData.
Dreher, A., Fuchs, A., Parks, B., Strange, A. M., & Tierney, M. J. (2021). Aid, China, and Growth: Evidence from a New Global Development Finance Dataset. American Economic Journal: Economic Policy, Vol. 13, no. 2, 2021, pp. 135–74.
Ferrière, N (2022). To Give or Not to Give? How Do Other Donors React to European Food Aid Allocation? The European Journal of Development Research, Palgrave Macmillan; European Association of Development Research and Training Institutes (EADI), Vol. 34(1), pp. 147-171.
Fuchs, A., Dreher, A., Nunnenkamp, P. (2014). Determinants of Donors Generosity: A Survey of the Aid Budget Literature. World Development, Vol. 56, pp. 172-199.
Frot, E.,Santiso, J. (2011). Herding in Aid Allocation, KYKLOS, Vol. 64, no.1, pp. 54-74.
Gilpin, S. I. (2023). China, Africa and the International Aid System: A Challenge to (the Norms Underpinning) the Neoliberal World Order? Journal of Asian and African Studies, Vol. 58, Issue 3, pp. 277-297.
Goodman-Bacon, A. (2021). Difference-in-difference with variation in treatment timing. Journal of Econometrics, Vol. 225, Issue 2, pp. 254-277.
Gounder, R., Sen, K. (1999). What Motivates Foreign Aid: A Case Study of Australia’s Aid to Indonesia. The Journal of Developing Areas, Vol. 33, no. 3, pp. 379–94.
Knack, S., Galiani, S., Xu, L.X., Zou, B. (2014). The Effect of Aid on Growth: Evidence from a Quasi-Experiment. Policy Research Working Paper Series 6865, The World Bank.
Lomøy, J. (2021). Chinese aid – a blessing for Africa and a challenge to western donors. Bergen: Chr. Michelsen Institute (CMI Insight 2021:2)
Mascarenhas, R., Sandler, T. (2006). Do donors cooperatively fund foreign aid? The Review of International Organisations, Vol.1, pp. 337–357.
Nationalencyklopedin (2026), Nya Sidenvägen. Available at: NE – Nya Sidenvägen (Accessed: 20 April 2026).
Nedopil, C. (2025). Countries of the Belt and Road Initiative. Shanghai, Green Finance & Development Center, FISF Fudan University, www.greenfdc.org
OECD (2024). Official development assistance (ODA): Frequently asked questions. Organisation for Economic Co-operation and Development. Available at: Official development assistance (ODA): Frequently asked questions (Accessed: 15 April 2026).
OECD (2026a). Preliminary official development assistance levels in 2025 – Detailed Summary Note. (DCD(2026)8). Organisation for Economic Co-operation and Development. Available at: https://one.oecd.org/document/DCD(2026)8/en/pdf (Accessed: 13 May 2026).
OECD (2026b). Development Assistance Committee. Organisation for Economic Co-operation and Development. Available at: Development Assistance Committee | OECD (Accessed: 21 April 2026).
OECD (2026c). Other Official Flows (OOF). Organisation for Economic Co-operation and Development. Available at: Other official flows (OOF) | OECD (Accessed: 21 April 2026).
OECD Data Explorer (2026). CRS: Creditor Reporting System (flows). Organisation for Economic Co-operation and Development. Available at: OECD Data Explorer • CRS: Creditor Reporting System (flows) (Accessed: 19 January 2026).
Oud, M., Almén, O. (2025), China as a Global Development Actor: Transforming the International Landscape, EBA Report 2025:08, The Expert Group for Aid Studies (EBA), Sweden, pp.15-40.
Perrotta Berlin, M. (2025). Perceptions and Power: Assessing the Impact of Russia’s influence on Attitudes Towards Development Cooperation Actors in Africa, Working Paper, The Expert Group for Aid Studies (EBA), Sweden.
Powell, A., Bobba, M. (2006). Multilateral Intermediation of Foreign Aid: What is the Trade-off for Donor Countries? IDB Publications (Working Papers) 1602, Inter-American Development Bank.
Rudyak, M. (2025). A European response – implications of China’s development finance for the EU and Sweden, in Oud, M. and Almén, O. (eds.). China as a Global Development Actor: Transforming the International Aid Landscape. EBA Report 2025:08, pp. 90-115. The Expert Group for Aid Studies (EBA), Sweden.
Schraeder, PJ., Hook, SW., Taylor, B. (1998). Clarifying the Foreign Aid Puzzle: A Comparison of American, Japanese, French, and Swedish Aid Flows. World Politics, Vol. 50, no. 2, pp. 294-323.
Tiboris, M. (2019). Addressing China’s Rising Influence in Africa. Chicago Council on Global Affairs.
van Teutem, S., Ritchie, H. (2025). Foreign aid from the United States saved millions of lives each year. Published online at OurWorldinData.org. Available at: Foreign aid from the United States saved millions of lives each year – Our World in Data [Online Resource] (archived on April 17, 2026). (Accessed: 1 May 2026)
Yuan, J., Su, F., Ouyang, X. (2022). China’s evolving approach to foreign aid. SIPRI Policy Paper No. 62. Stockholm International Peace Research Institute. Available at: China’s Evolving Approach to Foreign Aid | SIPRI
Younas, J. (2008). Motivation for bilateral aid allocation: Altruism or trade benefits. European Journal of Political Economy, Vol. 24, Issue 3, pp. 661-674.
Appendix
Table A1. DAC donors
|
Australia |
Belgium |
Czechia |
Estonia |
Finland |
Germany |
Hungary |
|
Ireland |
Japan |
Latvia |
Luxembourg |
New Zealand |
Poland |
Romania (Associate) |
|
Slovenia |
Sweden |
United Kingdom |
Austria |
Canada |
Denmark |
European Union |
|
France |
Greece |
Iceland |
Italy |
Korea |
Lithuania |
Netherlands |
|
Norway |
Portugal |
Slovak Republic |
Spain |
Switzerland |
United States |
Source: (OECD, 2026b)
Table A2. List of African countries in the study
|
Algeria |
Angola |
Benin |
Botswana |
Burkina Faso |
|
Burundi |
Cabo Verde |
Cameroon |
Central African Republic |
Chad |
|
Comoros |
Congo |
Côte d’Ivoire |
Democratic Republic of the Congo |
Djibouti |
|
Egypt |
Equatorial Guinea |
Eritrea |
Eswatini |
Ethiopia |
|
Gabon |
Gambia |
Ghana |
Guinea |
Guinea-Bissau |
|
Kenya |
Lesotho |
Liberia |
Libya |
Madagascar |
|
Malawi |
Mali |
Mauritania |
Mauritius |
Mayotte |
|
Morocco |
Mozambique |
Namibia |
Niger |
Nigeria |
|
Rwanda |
Sao Tome and Principe |
Senegal |
Seychelles |
Sierra Leone |
|
Somalia |
South Africa |
South Sudan |
Sudan |
Saint Helena |
|
Tanzania |
Togo |
Tunisia |
Uganda |
Zambia |
|
Zimbabwe |
Table A3. Sector classification
|
Sector code |
Sector name |
|
100 |
SOCIAL INFRASTRUCTURE & SERVICES |
|
110 |
EDUCATION |
|
120 |
HEALTH |
|
130 |
POPULATION POLICIES/PROGRAMMES AND REPRODUCTIVE HEALTH |
|
140 |
WATER SUPPLY AND SANITATION |
|
150 |
GOVERNMENT AND CIVIL SOCIETY |
|
160 |
OTHER SOCIAL INFRASTRUCTURE AND SERVICES |
|
200 |
ECONOMIC INFRASTRUCTURE &SERVICES |
|
210 |
TRANSPORT AND STORAGE |
|
220 |
COMMUNICATIONS |
|
230 |
ENERGY |
|
240 |
BANKING AND FINANCIAL SERVICES |
|
250 |
BUSINESS AND OTHER SERVICES |
|
300 |
PRODUCTION SECTORS |
|
310 |
AGRICULTURE, FORESTRY, FISHING |
|
320 |
INDUSTRY, MINING, CONSTRUCTION |
|
330 |
TRADE POLICIES AND REGULATIONS |
|
410 |
GENERAL ENVIRONMENTAL PROTECTION |
|
430 |
OTHER MULTISECTOR |
|
510 |
GENERAL BUDGET SUPPORT |
|
520 |
DEVELOPMENTAL FOOD AID/FOOD SECURITY ASSISTANCE |
|
530 |
OTHER COMMODITY ASSISTANCE |
|
600 |
ACTION RELATING TO DEBT |
|
720 |
EMERGENCY RESPONSE |
|
730 |
RECONSTRUCTION RELIEF AND REHABILITATION |
|
740 |
DISASTER PREVENTION AND PREPAREDNESS |
|
910 |
ADMINISTRATIVE COSTS OF DONORS |
|
930 |
REFUGEES IN DONOR COUNTRIES |
|
998 |
UNALLOCATED/UNSPECIFIED |
Table A4. Yearly average of Chinese official development finance before and after 2013
|
Period |
Mean (USD million) |
|
Pre 2013 (2000–2012) |
212.89 |
|
Post 2013 (2013–2021) |
441.20 |
Table A5. Share of ODA/OOF for China and DAC donors
|
Sector code |
Sector name |
China ODA (%) |
China OOF (%) |
DAC ODA (%) |
DAC OOF (%) |
|
240 |
BANKING AND FINANCIAL SERVICES |
0.20 |
99.80 |
60.50 |
39.50 |
|
510 |
GENERAL BUDGET SUPPORT |
1.60 |
98.40 |
100.00 |
0.00 |
|
250 |
BUSINESS AND OTHER SERVICES |
2.20 |
97.80 |
93.80 |
6.20 |
|
320 |
INDUSTRY, MINING, CONSTRUCTION |
3.20 |
96.80 |
73.30 |
26.70 |
|
430 |
OTHER MULTISECTOR |
3.50 |
96.50 |
99.70 |
0.30 |
|
230 |
ENERGY |
15.80 |
84.20 |
90.50 |
9.50 |
|
210 |
TRANSPORT AND STORAGE |
17.20 |
82.80 |
97.30 |
2.70 |
|
310 |
AGRICULTURE, FORESTRY, FISHING |
21.80 |
78.20 |
99.10 |
0.90 |
|
998 |
UNALLOCATED/UNSPECIFIED |
21.80 |
78.20 |
53.20 |
46.80 |
|
330 |
TRADE POLICIES AND REGULATIONS |
24.40 |
75.60 |
97.00 |
3.00 |
|
220 |
COMMUNICATIONS |
28.00 |
72.00 |
80.80 |
19.20 |
|
140 |
WATER SUPPLY AND SANITATION |
34.80 |
65.20 |
99.60 |
0.40 |
|
160 |
OTHER SOCIAL INFRASTRUCTURE AND SERVICES |
35.80 |
64.20 |
99.80 |
0.20 |
|
110 |
EDUCATION |
43.50 |
56.50 |
99.90 |
0.10 |
|
150 |
GOVERNMENT AND CIVIL SOCIETY |
47.60 |
52.40 |
100.00 |
0.00 |
|
120 |
HEALTH |
66.30 |
33.70 |
99.90 |
0.10 |
|
600 |
ACTION RELATING TO DEBT |
84.00 |
16.00 |
99.70 |
0.30 |
|
530 |
OTHER COMMODITY ASSISTANCE |
90.40 |
9.60 |
100.00 |
0.00 |
|
130 |
POPULATION POLICIES/PROGRAMMES AND REPRODUCTIVE HEALTH |
100.00 |
0.00 |
100.00 |
0.00 |
|
410 |
GENERAL ENVIRONMENTAL PROTECTION |
100.00 |
0.00 |
99.90 |
0.10 |
|
520 |
DEVELOPMENTAL FOOD AID/FOOD SECURITY ASSISTANCE |
100.00 |
0.00 |
100.00 |
0.00 |
|
720 |
EMERGENCY RESPONSE |
100.00 |
0.00 |
100.00 |
0.00 |
|
730 |
RECONSTRUCTION RELIEF AND REHABILITATION |
100.00 |
0.00 |
100.00 |
0.00 |
|
740 |
DISASTER PREVENTION AND PREPAREDNESS |
100.00 |
0.00 |
100.00 |
0.00 |
|
100 |
SOCIAL INFRASTRUCTURE & SERVICES |
0.00 |
100.00 |
||
|
200 |
ECONOMIC INFRASTRUCTURE & SERVICES |
0.00 |
100.00 |
||
|
300 |
PRODUCTION SECTORS |
0.00 |
100.00 |
||
|
910 |
ADMINISTRATIVE COSTS OF DONORS |
99.90 |
0.10 |
||
|
930 |
REFUGEES IN DONOR COUNTRIES |
100.00 |
0.00 |
Table A6. Top 10 sectors by growth in Chinese development finance
|
Sector code |
Sector name |
Pre 2013 |
Post 2013 |
Growth (levels) |
Growth (%) |
|
240 |
BANKING AND FINANCIAL SERVICES |
0.20 |
99.80 |
60.50 |
39.50 |
|
510 |
GENERAL BUDGET SUPPORT |
1.60 |
98.40 |
100.00 |
0.00 |
|
250 |
BUSINESS AND OTHER SERVICES |
2.20 |
97.80 |
93.80 |
6.20 |
|
320 |
INDUSTRY, MINING, CONSTRUCTION |
3.20 |
96.80 |
73.30 |
26.70 |
|
430 |
OTHER MULTISECTOR |
3.50 |
96.50 |
99.70 |
0.30 |
|
230 |
ENERGY |
15.80 |
84.20 |
90.50 |
9.50 |
|
210 |
TRANSPORT AND STORAGE |
17.20 |
82.80 |
97.30 |
2.70 |
|
310 |
AGRICULTURE, FORESTRY, FISHING |
21.80 |
78.20 |
99.10 |
0.90 |
|
998 |
UNALLOCATED/UNSPECIFIED |
21.80 |
78.20 |
53.20 |
46.80 |
|
330 |
TRADE POLICIES AND REGULATIONS |
24.40 |
75.60 |
97.00 |
3.00 |
Table A7. Main specification (1), logged results
|
DAC OOF (logged) |
DAC ODA (logged) |
|
|
Treatment effect |
0.022** (0.010) |
0.029 (0.031) |
|
Number of observations |
178614 |
178614 |
|
R2 |
0.090 |
0.326 |
|
Adjusted R2 |
0.082 |
0.320 |
|
Pair fixed effects |
Yes |
Yes |
|
Donor fixed effects |
Yes |
Yes |
|
Year fixed effects |
Yes |
Yes |
Notes: The dependent variables are expressed in logarithmic form, and coefficients can therefore be interpreted as average percentage changes. Standard errors, reported in parentheses, are clustered two-way at the recipient country and sector levels. The specification includes country-sector pair fixed effects. *p <0.10, **p<0.05, ***p<0.01
For DAC OOF, the estimated treatment effect is positive and statistically significant at the 5 % level. The coefficient of 0.022 suggests that, following the introduction of the BRI, DAC OOF flows increased by approximately 2.2 % in treated country-sector pairs relative to the control group. This provides further support for the baseline result that DAC donors expand non-concessional financing in treated pairs in response to increased Chinese development finance. The estimated effect for DAC ODA is positive but not statistically significant. This aligns with the main results, strengthening the findings that concessional aid does not exhibit a systematic response to Chinese financing.
Table A8. Results with different ways of clustering the standard errors
|
ODA (two-way) |
ODA (recipient) |
ODA (sector) |
OOF (two-way) |
OOF (recipient) |
OOF (sector) |
|
|
Treatment × Post (Top 20 %) |
0.658 (0.511) |
0.658* (0.333) |
0.658 (0.500) |
0.229*** (0.072) |
0.229*** (0.076) |
0.229 (0.153) |
|
Num.Obs. |
178631 |
178631 |
178631 |
178631 |
178631 |
178631 |
|
R2 |
0.165 |
0.165 |
0.165 |
0.024 |
0.024 |
0.024 |
|
R2 Adjusted |
0.157 |
0.157 |
0.157 |
0.016 |
0.016 |
0.016 |
|
Pair FE |
Yes |
Yes |
Yes |
Yes |
Yes |
Yes |
|
Donor FE |
Yes |
Yes |
Yes |
Yes |
Yes |
Yes |
|
Year FE |
Yes |
Yes |
Yes |
Yes |
Yes |
Yes |
|
SE clustering |
Recipient + Sector |
Recipient |
Sector |
Recipient + Sector |
Recipient |
Sector |
Notes: Coefficients are reported in USD millions. Standard errors, reported in parentheses, are clustered as indicated in the final row of the table. All specifications include country-sector pair fixed effects, donor fixed effects, and year fixed effects. Treatment is defined as the top 20 % of country-sector pairs by growth in Chinese finance after 2013. * p < 0.10, ** p < 0.05, *** p < 0.01
The results remain consistent across alternative clustering strategies. For DAC OOF, the estimated treatment effect remains positive across all specifications and statistically significant at the 1 % level when clustering at the recipient level and under two-way clustering. The statistical significance weakens when clustering only at the sector level. Although the magnitude of the estimated coefficient remains unchanged. For DAC ODA, the estimated coefficients are consistent across specifications, but only statistically significant (at the 10 % level) when clustering at the recipient level. The estimated effect is no longer statistically significant under the preferred two-way clustering specification. Overall, the findings support the conclusion that DAC responses to Chinese development finance are concentrated in non-concessional financial flows rather than concessional aid.
Details of the data on Chinese development finance
AidData’s Global Chinese Development Finance Dataset, Version 3.0, tracks project commitments between 2000 to 2021. It includes information on 20 985 projects commitments across 165 low- and middle-income countries financed through Chinese official sector loans and grants. Of the 20 985 recorded projects, 17 957 are formally approved, active, or completed, while the remainder consist of suspended, cancelled, or unconfirmed activities, indicating that the dataset primarily captures realised or actively implemented financial commitments. These projects are worth are total of 1.34 trillion USD (Custer et al., 2023).
The dataset is developed through AidData’s Tracking Underreported Financial Flows-methodology, also called the TUFF-methodology. The TUFF-methodology was introduced by AidData in 2013 as a way of tracking Chinese foreign development finance projects. The approach assembles and standardises project-level information from a broad range of open-source materials, such as statements and document from Chinese and recipient-country authorities, information published by international organisations, companies and NGOs, as well as media outlets and research institutes. To enhance transparency and reliability, each project record is linked to the underlying source material, with detailed documentation of the sources used in the data construction. Whenever possible, priority is given to official sources directly involved in the financing or implementation of the project. In the 3.0 version of the dataset, 87 % of the project records has been constructed with at least one official source, hence from funding, implementing or recipient agencies that are directly involved in or have firsthand knowledge of the transfer supporting the project (Custer et.al., 2023).
-
United States Agency for International Development.
-
This paragraph is reproduced from my previous term paper for the course Economics and Public Policy (EC7419), submitted in Fall 2025.
-
This paragraph is reproduced from my previous term paper for the course Economics and Public Policy (EC7419), submitted in Fall 2025.
Working Paper, September 2026 to The Expert Group for Aid Studies (EBA)
The EBA Working Paper Series constitutes shorter overviews, surveys, mappings and analyses that have been undertaken to bring about discussion and advance knowledge of a particular topic. Working Papers are not subject to any formal approval process by the Expert Group. Just as in the EBA reports, authors are solely responsible for the content, conclusions and recommendations.
Please refer to the present report as: Zeidan Mellqvist, R., Chinese Development Finance and OECD DAC Donor Responses: Evidence from Africa, Working Paper September 2026, The Expert Group for Aid Studies (EBA), Sweden.